


2013-12-07 18:59:56: Marc-Oliver Pahl
2013-12-06 13:39:19: Marc-Oliver Pahl
2013-12-06 13:39:12: Marc-Oliver Pahl
2013-12-05 00:16:21: Marc-Oliver Pahl
...
2013-12-12 22:00:09: Marc-Oliver Pahl
2013-12-11 17:42:30: Marc-Oliver Pahl
2013-12-11 17:42:21: Marc-Oliver Pahl
2013-12-09 17:35:54: Marc-Oliver Pahl
...
 Here you can download the ePub version of your lab. The
ePub will always contain the data you currently have access to.
Here you can download the ePub version of your lab. The
ePub will always contain the data you currently have access to.
1. We are looking forward to your feedback!
Hi __FORENAME__, this lab is quite new. Therefore we are even more looking forward to your comments and suggestions than in the other labs!
We tested all components intensively but still we may have overlooked some things. So keep in mind that not everything in this lab must necessarily work as intended.
Whenever you have suggestions on how we can improve the lab (e.g. by adding specific information, giving this or that additional instruction) please let us know via the comment field. Thank you!
The more precise your feedback is and the clearer your suggestion are, the better we can implement them... Thank you!
Have fun with the Smart Space Lab!

2013-12-04 21:14:49: Marc-Oliver Pahl
2013-12-04 20:41:08: Marc-Oliver Pahl
2013-12-04 20:40:10: Marc-Oliver Pahl
2013-12-04 20:39:01: Marc-Oliver Pahl
...
What is this lab about?
This lab is about the Distributed Smart Space Orchestration System (DS2OS). The aim of DS2OS is to enable the emergence of Smart Spaces from research labs into everyday life.
But what is a Smart Space? A Smart Space is a physical environment that is enriched with networked Smart Devices.
But what are Smart Devices? Smart Devices are hardware devices that contain an embedded system with a microprocessor and a network interface and sensors and actuators the can be used to interact with the physical world.
From their interaction, the systems we look at in this lab, are also often called Cyber-Physical-Systems (CPS). Another term that is common in the domain we are looking at is Internet of Things (IoT). It describes that entities are connected to the Internet and can be controlled from remote.
As you will learn in this lab, there are two domains of high relevance when creating smart spaces:
- Context management.
- Service management.
DS2OS covers these two domains with its parts:
- Virtual State Layer (VSL) -- a context-aware µ-middleware.
- Smart Space Store (S2S) -- a service management framework that provides similar functionality to a smartphone App Store to smart spaces.
In the practical part of this lab you will cover everything that is necessary for creating your own Smart Spaces in a Do-It-Yourself (DIY) way:
- You will create your own smart device based-on the Arduino platform, and write your firmware to make it remote controllable.
- You will write a device driver for your device to make it accessible in a more abstract way.
- You will write an Advanced Reasoning Service to derive information from your device and other context sources, and to make it available for other services. This kind of service helps modularizing functionality in DS2OS.
- Finally you will write an Orchestration Service that realizes a complex work flow in a simple way.
This lab has several learning goals, including:
- Reading and understanding research papers.
- Learning something about the history of computing.
- Getting familiar with
- Ubiquitous Computing
- Pervasive Computing
- Middleware
- Service Oriented Architecture
- Distributed Systems
- A complex distributed peer-to-peer system
- Evaluating a complex system.
- Statistical analysis of measurement results.
Befor we continue, here some funny things we did with the system in 2011:
As the system has grown since then you can easily reproduce this demo after having done this lab. Think about what you could do if such a system would run everywhere you are...
2013-12-04 21:13:33: Marc-Oliver Pahl
2013-12-04 21:13:11: Marc-Oliver Pahl
2013-12-04 21:12:50: Marc-Oliver Pahl
2013-12-04 21:11:54: Marc-Oliver Pahl
...
In this lab you will find some research papers. Take the opportunity not only to get information out of them but also to get familiar with the style such papers are written. For your bachelor thesis, master thesis, or maybe a Phd it is important that you can communicate with your scientific peers in an appropriate way. Reading such written documents is a good exercise to get familiar with the scientific world.
The numbers in brackets [1] are links to research papers as you find them in scientific papers. Like in a paper you find the list of references at the end of this prelab.
This lab only contains a small selection of papers. If you are interested in certain aspects you can use the references of the papers listed here as a starting point.
2013-12-07 19:38:06: Marc-Oliver Pahl
2013-12-07 18:57:28: Marc-Oliver Pahl
2013-12-07 18:56:50: Marc-Oliver Pahl
2013-12-04 21:23:05: Marc-Oliver Pahl
...
An Evolution of Computing
Let us start with a look at computing [3]:
In the 1960s the computing world was dominated by mainframe computers. Many people shared one mainframe that was operated by professional administrators.
In the 1980s Perconal Computers (PC) emerged. Over the years people had PCs at home. The relation between users and PCs shifted to few users that shared a PC. PCs were typically administrated by their users.
In the 2000s Mobile Computing became reality. Smartphones and Pads became common computing devices. Now one user typically had multiple devices on her own.
In the 2010s it is likely that sharing devices becomes more popular again. Public devices such as public screens will be available to all passing humans resulting in a many-to-many device-individual relationship.
Looking at the development from a spatial point-of-view, computing moved from dedicated computing centers to offices, to homes, to everywhere. The trend of public devices will make this ubiquity even more reality.
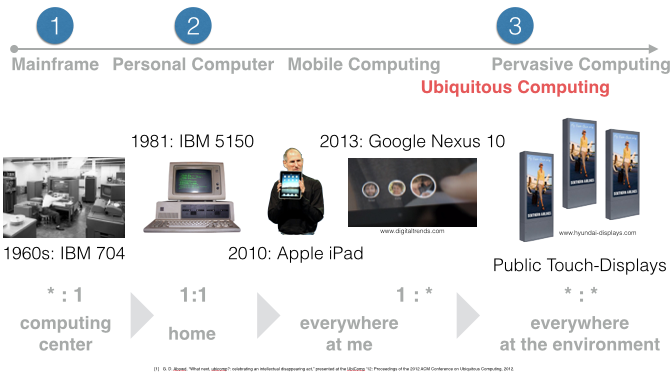
An evolution of computing [Pahl2013]
2013-12-07 18:06:59: Marc-Oliver Pahl
2013-12-07 18:06:32: Marc-Oliver Pahl
2013-12-04 21:54:25: Marc-Oliver Pahl
2013-12-04 21:48:55: Marc-Oliver Pahl
...
The Beginning of Ubiquitous Computing
Did you ever hear about Xerox? It is the company that holds the patent on Xerography which is used in many of the copy machines. The company used the money it made to found research in its famous Xerox Palo Alto Research Center (PARC). Many of the technologies that are common to you today found their origin at this lab.
While doing brillant research, Xerox Parc did not manage to commercialize their ground-braking results. Other companies like Apple did that job.
In 1991, a group at Xerox Parc that was led by Mark Weiser worked on a vision they called Ubiquitous Computing. When looking at the picture, reading the papers [1,2], and watching the video keep in mind that this was 1991.
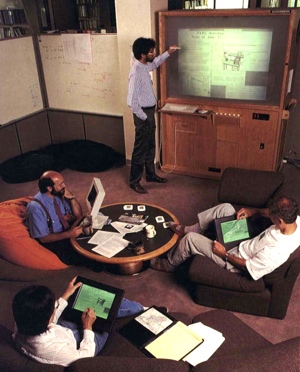
Scientific American, Sep. 1991.
Take a look at Fig. 1. Would you have guessed that this picture was taken in 1991? The picture shows a demonstrator at Xerox Palo Alto Research Center (PARC) in California. The following video gives an impression from the demo:
Inform yourself about Xerox PARC and the inventions made there.
The paper [1] marks the beginning of a new research field: ubiquitous computing.
Read the papers [1,2,3,4].
According to [4], UbiquitousComputing can be divided into the areas mobile computing and pervasive computing. See Fig. 2.
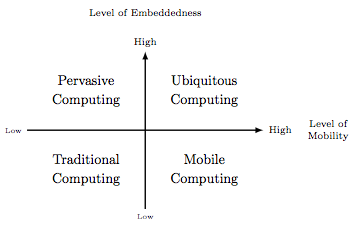
Mobile computing can be paraphrased as "computing everywhere", pervasive computing can be described as "computing in everything".
Mobile computing is reality today:
Even in developing countries cellular networks that are capable of transporting data are available today. Smart devices like smartphones, tablet, laptops, etc. offer network access from almost everywhere [5].
Cloud computing offers the remote use of literally unlimited computing ressources via the devices named before [6].
Pervasive computing is not reality yet [4].
Devices that contain processors are ubiquitous. Even networked sensors and actuators could be bought off-the-shelf at affordable prices in regular shops in 2013 [7].
Heterogeneity is a big problem for realizing pervasive computing scenarios today. Think on the user story about Sal that you read in [1]. The technology is available. You could probably also program a solution. But it would be custom built. You could not run it at your friends' places, or with different hardware.
This lab is about overcoming this heterogeneity.
2013-12-07 18:08:16: Marc-Oliver Pahl
2013-12-07 18:07:47: Marc-Oliver Pahl - created -
2013-06-13 13:25:06: Marc-Oliver Pahl
2013-06-13 13:20:51: Marc-Oliver Pahl
2013-06-13 13:20:30: Marc-Oliver Pahl
2013-06-13 13:09:38: Marc-Oliver Pahl - created -
...
2013-06-13 13:18:12: Marc-Oliver Pahl
2013-06-13 13:17:35: Marc-Oliver Pahl
2013-06-13 13:16:26: Marc-Oliver Pahl
2013-06-13 13:09:37: Marc-Oliver Pahl - created -
...
2013-06-13 14:00:00: Marc-Oliver Pahl
2013-06-13 13:09:38: Marc-Oliver Pahl - created -
To realize scenarios where devices interact it is necessary that the involved devices can interact. For different reasons this is not given. Instead hardware devices are often heterogeneous in their interfaces which makes controlling them remotely complex.
Reasons for Heterogeneity
There are several reasons why the communication protocols used by smart space hardware devices are heterogeneous. We will present some of them now.
- Historically the different domains for orchestrating a space like heating, ventilation, air conditioning, lighting were separated. Different vendors offered (usually closed) solutions for the domains. Connecting the formerly separate domains is still new. The domains were not build for such a functional merge.
- Market tactical considerations are a reason for heterogeneity. When hardware of vendor A is not interoperable with hardware of vendor B consumers lock in to a vendor. A consumer that has several devices of vendor A cannot get tempted to buy hardware of vendor B as it would not extend the smartness of the space but create another functional island.
- Technically different device one can buy to sense and actuate (orchestrate) a space serve heterogeneous purposes. According to their intended use they bring different ressources (like CPU, memory, network interface, power supply) and they are mounted in different ways. Extremes are PC-like embedded devices like Raspberry PIs on one end and integrated, battery-powered, wirelessly connected devices on another end.
The historic dimension may disappear with time. The market tactical reason could disappear with standardisation. The technical reasons for heterogeneous communication interfaces will not disappear as they make sense to take best advantage of the requirements of a device.
2013-07-02 22:01:54: Marc-Oliver Pahl
2013-07-02 14:23:38: Marc-Oliver Pahl
2013-06-13 19:17:52: Marc-Oliver Pahl
2013-06-13 18:18:25: Marc-Oliver Pahl
...
2013-06-19 13:38:26: Marc-Oliver Pahl
2013-06-13 20:56:52: Marc-Oliver Pahl
2013-06-13 20:55:51: Marc-Oliver Pahl - created -
There are different automation systems that are used in commercial buildings. The following text gives a brief overview on some of the technologies used.
Devices are the interface between software and the physical world. Many devices that are installed today are parts of so-called Building Automation Systems.
There are several wide spread technologies and standards that are used in (commercial) buildings all over the world today.
Often those technologies focus on the core domains heating, ventilation, air conditioning, and lighting (HVACL).
We have a quick look at some of the technologies to give you an overview.
2013-06-13 21:00:42: Marc-Oliver Pahl
2013-06-13 20:59:01: Marc-Oliver Pahl
2013-06-13 20:51:20: Marc-Oliver Pahl
2013-06-13 19:54:04: Marc-Oliver Pahl
...
European Installation Bus (EIB/KNX)
The European Installation Bus KNX is a standardised bus system that is used to connect sensors and actuators in a building.Typical devices that are connected using KNX are light sensors, motion detectors, switches, relays, motors, and heating controls.
The FMI building of Technische Universität München in Garching is using KNX for controlling the shutters and the lights for instance.
KNX communication is standardised over twisted pair, power line, radio, and Ethernet.
Data is transmitted in KNX frames as follows:

Some ressources if you are interested in more details:
2013-06-13 20:27:51: Marc-Oliver Pahl
2013-06-13 19:54:38: Marc-Oliver Pahl
2013-06-13 19:54:08: Marc-Oliver Pahl - created -
2013-06-19 14:20:23: Marc-Oliver Pahl
2013-06-19 14:08:53: Marc-Oliver Pahl
2013-06-19 14:06:26: Marc-Oliver Pahl
2013-06-19 14:05:51: Marc-Oliver Pahl
...
Local Operating Network (LON)
Similar to KNX LON is a normed bus system to connect entities within a building. It is a proprietary technology but it is widespread especially in the US.
Short description.
Typical domains where LON is used are heating, air conditioning, lighting, shutter control, security, multimedia.
LON is used in many commercial buildings, especially in the US.
For physical connectivity LON supports twisted pair, power line, radio, coax, fiber, infrared.
The LON topology can be hierarchical while the KNX is primarily a flat bus structure. LON sells special chips that do the communication. They are called Neuron chips.
LON communicates over LONtalk as follows:
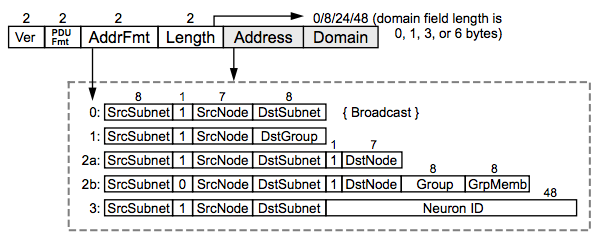
Some ressources if you are interested in more details:
2013-06-13 20:49:21: Marc-Oliver Pahl
2013-06-13 20:27:08: Marc-Oliver Pahl
2013-06-13 20:21:51: Marc-Oliver Pahl
2013-06-13 20:21:03: Marc-Oliver Pahl
...
2013-06-19 14:19:12: Marc-Oliver Pahl
2013-06-19 14:16:28: Marc-Oliver Pahl
2013-06-19 14:15:09: Marc-Oliver Pahl
2013-06-19 13:47:46: Marc-Oliver Pahl
...
2013-06-19 13:53:26: Deniz Ugurlu
2013-06-19 13:51:52: Marc-Oliver Pahl
2013-06-19 13:51:27: Marc-Oliver Pahl
2013-06-19 13:48:08: Marc-Oliver Pahl - created -
...
2013-06-19 13:44:39: Marc-Oliver Pahl
2013-06-19 13:44:27: Marc-Oliver Pahl
2013-06-19 13:42:09: Marc-Oliver Pahl - created -
Let's have a look at some more protocols that are used for managing and controlling elements within a spaces.
REpresational State Transfer (REST)
You all know REpresational State Transfer (REST) interfaces. The World Wide Web has a REST interface. The HTTP protocol contains methods like:
- GET
- POST
- PUT
- PATCH
- DELETE
They are used to retrieve or manipulate the representation of the state of a resource (e.g. a website). One property of REST communication is that it is usually stateless. The client and the server do not establish a connection and store context about each other.
REST interfaces in form of HTTP accessible websites are offered for many consumer devices today. They are often primarily intended for direct user interaction like the following interface of a remote control capable power plug:
Such interfaces can be scripted. In our example we can make the following call to set the state of the switch of the power plug:
http://192.168.4.1/r?b=1&r=0&s=[0|1]
With the following command we can retrieve the state of the switch of the device:
http://192.168.4.1/r?b=1&r=0&s=1
The returned HTML output is:
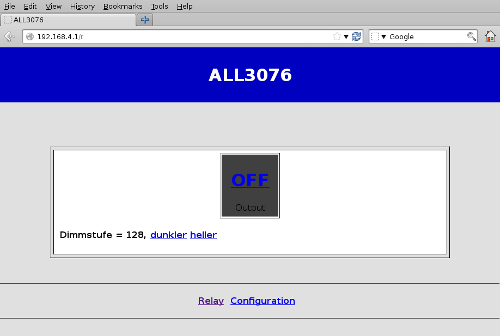
<!DOCTYPE HTML PUBLIC "-//W3C//DTD HTML 4.01 Transitional//EN" "http://www.w3.org/TR/html4/loose.dtd"><HTML><HEAD><TITLE>ALL3076</TITLE><STYLE TYPE="text/css">body { font-family: helvetica, sans-serif; color: black}</STYLE></HEAD><BODY LEFTMARGIN=0 TOPMARGIN=0 MARGINWIDTH=0 MARGINHEIGHT=0 BGCOLOR="#E0E0E0"><TABLE BORDER=0 WIDTH="100%" CELLSPACING=0 CELLPADDING=10><TR><TD WIDTH="100%" ALIGN="CENTER" BGCOLOR="#0000C0"><H1><FONT COLOR="#FFFFFF">ALL3076</FONT></H1></TD></TR></TABLE><H4><BR> <BR></H4><CENTER><TABLE BORDER=1 WIDTH="80%" CELLPADDING=5 CELLSPACING=5><TR><TD BGCOLOR="#FFFFFF"><CENTER><TABLE BORDER=1 WIDTH=110 HEIGHT=110><TR>
<TD WIDTH=110 HEIGHT=110 BGCOLOR="#404040" ALIGN=CENTER><H1><A HREF="/r?b=1&r=0&s=1">OFF</A></H1>Output</TD>
</TR></TABLE></CENTER><H4> Dimmstufe = 128, <A HREF=r?d=0>dunkler</A> <A HREF=r?d=1>heller</A><BR></H4></TD></TR></TABLE><BR><BR><HR><H4><A HREF="r">Relay</A> <A HREF="config.html">Configuration</A> </H4><HR><BR></CENTER></BODY></HTML>
It can be parsed with a regex (see multiple-choice question).
Similar RESTful APIs are available for many devices today. The popularity of smartphones is an economic factor that motivates vendors to provide REST HTTP gateways to their proprietary devices to allow remote control via the vendor's smartphone apps...
In the lab we will see how we can make use of this.
2013-06-26 18:58:30: Marc-Oliver Pahl
2013-06-26 18:58:17: Marc-Oliver Pahl
2013-06-19 15:03:34: Marc-Oliver Pahl
2013-06-19 14:57:53: Marc-Oliver Pahl
...
2013-06-19 14:56:57: Marc-Oliver Pahl
2013-06-19 14:56:13: Marc-Oliver Pahl
2013-06-19 14:55:51: Marc-Oliver Pahl
2013-06-19 14:54:55: Marc-Oliver Pahl
...
Web Services
Web services (WS) are applications that are accessible to other web services over the web (HTTP). Web services are a convenient way to realize a distributed Service Oriented Architecture (SOA).
Web services use the Simple Object Access Protocol (SOAP) for communication over HTTP, SMTP, and other transports. The messages exchanged between different services are usually encoded in XML.
To allow the remote use and the reuse of services their interfaces have to be standardised. This happens using the Web Service Description Language (WSDL). An important part of the WSDL description of a service are the signatures of the programming interface of the service (API).
To share the information about an interface the so-called Universal Description Discovery and Integration (UDDI). Besides other information the UDDI contains the WSDL descriptions of services.
Even though the web service architecture has promising features it is not widely used in devices today.
2013-06-14 16:30:10: Marc-Oliver Pahl
2013-06-14 16:07:39: Marc-Oliver Pahl
2013-06-14 14:18:54: Marc-Oliver Pahl
2013-06-14 14:18:17: Marc-Oliver Pahl - created -
...
Simple Network Management Protocol (SNMP)
The Simple Network Management Protocol (SNMP) is a protocol that comes from the network management community. It is used to remotely manage and control network entities like routers in the Internet. Even though SNMP was meant as a provisory solution at the beginning it was improved and is still widely use today. A reason for that is its simplicity.
For communication over SNMP devices run so-called agents. Managing entities (manager) connect to the agents to obtain and change information on the devices.
Information is provided as key-value pairs under hierarchically structured addresses. The structure of the information is defined in the so-called Management Information Base (MIB). The syntax used for specifying the MIB of a device is called Structure of Management Information (SMI). SMI is a subset of the Abstract Syntax Notation 1 (ASN.1).
A MIB entry looks as follows:
NET-SNMP-EXAMPLES-MIB DEFINITIONS ::= BEGIN
...
--
-- Example scalars
--

netSnmpExampleInteger OBJECT-TYPE
    SYNTAX      Integer32
    MAX-ACCESS  read-write
    STATUS      current
    DESCRIPTION
        "This is a simple object which merely houses a writable
         integer.  It's only purposes is to hold the value of a single
         integer.  Writing to it will simply change the value for
         subsequent GET/GETNEXT/GETBULK retrievals.

         This example object is implemented in the
         agent/mibgroup/examples/scalar_int.c file."
    DEFVAL { 42 }
    ::= { netSnmpExampleScalars 1 }
...
SNMP agents usually listen on the well-known ports:
- 161/udp SNMP
- 162/udp SNMPTRAP
A get-request to port 161 of a device is used to obtain information at a
certain address in the device's MIB tree. Such a request could be snmpget -c public
localhost system.sysDescr.0. With the getnext-command it is possible to
walk through MIBs as is simply returns the values of the next node in the MIB tree.
Additional to the synchronous get-request SNMP provides an asynchronous
publish-subscribe mechanism. It is called SNMP trap. SNMP agents can subscribe
to a trap (e.g. an alarm). When the trap event occurs the SNMP
agent sends a notification to port 162 of the subscribing agent (e.g. snmptrap -c
community1 -h 2000:1:1:1:209:6bff:feae:6d67 -m hello world).
2013-06-15 18:36:29: Marc-Oliver Pahl
2013-06-15 18:35:14: Marc-Oliver Pahl
2013-06-15 18:20:31: Marc-Oliver Pahl
2013-06-14 17:07:58: Marc-Oliver Pahl
...
2013-06-15 18:43:15: Marc-Oliver Pahl
2013-06-15 18:41:00: Marc-Oliver Pahl - created -
2013-06-15 18:50:25: Marc-Oliver Pahl
2013-06-15 18:48:28: Marc-Oliver Pahl
2013-06-15 18:41:12: Marc-Oliver Pahl - created -
In the automation domain which we are looking at in this lab reprogramming of components is seldom. Usually the devices are programmed once (or the functionality is even hard wired). Installing software updates on a shutter or a climate control is no regularly done operation for instance.
Especially in the Heating, Ventilation, Air Conditioning, and Lighting domains it is common that each system is closed and contains a separate control logic like an A/C control panel in the room the A/C is mounted. The peripherals (e.g. temperature sensors) are connected to the control element and no information leaves the domain.
In order to realise flexible control scenarios like the one described in the Weiser article it is desired to have access to the values of the sensors and actuators in a space. In this lab we will see how this is possible.
Orchestrating spaces with software is desired. Stored-program architectures allow flexible usage as the programs can easily be changed and thereby the purpose of a device can be changed. To realize smart space scenarios it is necessary to have software-based orchestration. Only this way the intended flexible use can be realised.
To realise software-based orchestration the common approach is to write drivers for the specific devices used in the setup. The drivers are run on the machine that contains the program that realises the orchestration logic / work flows. Often a monolithic approach (one control and management PC) is used.
The described approach works well for research projects with relatively fixed setups and little changes. For real world setups it does not scale. As we have seen in the previous section there are lots of different devices with lots of different protocols. Each combination needs a driver.
It is very likely that real world smart spaces will differ in the available functionality they offer, the devices that are used for each functionality, and thereby the communication protocols.
Therefore we developed a framework that enables and facilitates distributed development of software services like drivers, or orchestration logic for smart spaces.
2013-06-15 23:37:59: Marc-Oliver Pahl
2013-06-15 23:33:51: Marc-Oliver Pahl
2013-06-15 23:23:52: Marc-Oliver Pahl
2013-06-15 23:14:16: Marc-Oliver Pahl
...
2013-06-27 00:23:08: Marc-Oliver Pahl
2013-06-27 00:21:56: Marc-Oliver Pahl - created -
Pervasive computing contains Distributed Computing. A distributed computing system consists of distributed computing nodes that are connected over a network. The distributed nodes can be heterogeneous in their hardware and software [8].
Covering the heterogeneity and the distribution are tasks done by Middleware.
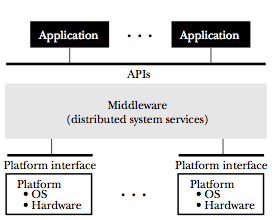
A Middleware Architecture [8]
Read paper [8].
2013-12-07 18:39:51: Marc-Oliver Pahl
2013-12-07 18:38:32: Marc-Oliver Pahl
2013-12-06 13:39:29: Marc-Oliver Pahl - created -
2013-12-07 18:52:22: Marc-Oliver Pahl
2013-12-07 18:48:51: Marc-Oliver Pahl - created -
Software service need input to orchestrate a smart space. This input is called context.
Context can contain different information such as spatial context, temporal context, device context, network and communication context, environmental context, individuality and user profile context, activity context, mental context, or interaction context [9].
A typical context processing cycle is [9]:
- collect
- analyze & aggregate
- decide
- act & adapt
We will create such a control cycle in the lab by ourself.
Have a look at the sections II and III of [9].
2013-12-07 19:41:47: Marc-Oliver Pahl
2013-12-07 19:41:24: Marc-Oliver Pahl
2013-12-07 19:40:57: Marc-Oliver Pahl
2013-12-07 19:39:31: Marc-Oliver Pahl
...
2013-12-07 19:55:01: Marc-Oliver Pahl
2013-12-07 19:54:19: Marc-Oliver Pahl - created -
8.1. Middleware for Smart Space Orchestration
As described before, software orchestration allows a flexible use of installed hardware of a smart space. There are lots of pervasive computing [9] scenarios for smart spaces from domains such as health, sustainability, security, or comfort. To realize the scenarios, software orchestration is necessary [11,12,14].
Middleware aims to provide a unified interface to a distributed system. It typically provides management and communication functionality that makes the challenging characteristics of a distributed system transparent to software developer. This facilitates the development for distributed systems significantly.
Besides bridging the heterogeneity between computation nodes that execute programs, a middleware for smart spaces must bridge device heterogeneities. A way to do so is providing unified interfaces to heterogeneous devices.
The bridging of the computing environment and device heterogeneities allows to create portable service for smart spaces that can run in different smart spaces with the different hardware installed there. For realizing portability, it is necessary to provide a representation for the abstract interface to a certain device class.
In this section, three different design approaches for middleware for smart spaces are presented:
- The first approach is a centralized middleware that is based on function calls. It targets homes with devices such as gaming consoles or cameras.
- The second approach is a distributed system. It is based on function calls and context representing tuples that can be queried. The system targets commercial buildings with professional Building Automation Systems.
- The third solution is the one we will have a closer look at in this lab. It is fully distributed and solely based on the exchange of context tuples. It targets both areas, the home and commercial or public spaces.
2013-12-07 22:10:01: Marc-Oliver Pahl
2013-12-07 22:04:41: Marc-Oliver Pahl
2013-06-26 19:20:28: Marc-Oliver Pahl
2013-06-26 19:04:32: Marc-Oliver Pahl
...
Microsoft Research develops a solution that is called HomeOS.
Their proposal is to have a central computer inside a home that controls and manages all devices. Peripherals are connected to this computer and presented to the locally running orchestration services via locally running drivers.
Drivers provide abstract interfaces to device classes. To realize the adaption, two layer concept with a lower level and a higher level component is presented. One layer is closer to the hardware's protocol (DCL) and one provides the abstract interface towards the software (DFL). See Fig. 3.
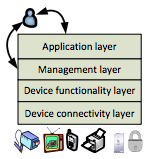
The HomeOS middleware uses so-called roles as abstraction. A role is a collection of method signatures. Roles are intended for device drivers. To implement a certain role, a device driver has to offer the methods specified in its role (see Device Functionality Layer in Fig. 3). A role defines, which functions can be called on the instance that offers the role (e.g. a lamp).
Get an overview of HomeOS with the papers [10,11].
2013-12-07 22:45:53: Marc-Oliver Pahl
2013-12-07 22:44:04: Marc-Oliver Pahl
2013-12-07 22:11:40: Marc-Oliver Pahl
2013-06-27 00:55:26: Marc-Oliver Pahl
...
2013-06-26 19:25:50: Marc-Oliver Pahl
2013-06-26 19:25:12: Marc-Oliver Pahl
2013-06-26 19:24:25: Marc-Oliver Pahl
2013-06-26 19:24:13: Marc-Oliver Pahl
...
2013-06-26 19:30:12: Marc-Oliver Pahl
2013-06-26 19:28:52: Marc-Oliver Pahl - created -
At the University of California, Berkeley, the Building Application Stack (BAS) is developed.
The main goal of the solution is to make orchestration services portable. The application domain the solution is targeted for are Building Automation Systems like the ones we had a look at before.
Get an overview on the so-called BAS middleware looking at [12]. Fig. 4 shows the main components of the middleware. The device driver concept is again divided into an abstract part on top and a device-specific part on the bottom.
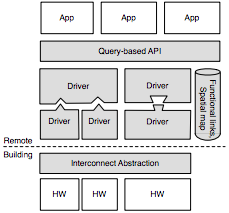
Like in HomeOS the system abstraction is method based. So-called classes bundle the methods that a driver for a certain device type must offer.
Look at the basic services for BAS in [13].
2013-12-07 22:59:01: Marc-Oliver Pahl
2013-12-07 22:44:45: Marc-Oliver Pahl
2013-12-07 22:12:31: Marc-Oliver Pahl
2013-07-02 22:09:21: Marc-Oliver Pahl
...
2013-06-26 19:52:21: Marc-Oliver Pahl
2013-06-26 19:50:20: Marc-Oliver Pahl - created -
2013-06-26 20:02:48: Marc-Oliver Pahl
2013-06-26 19:58:01: Marc-Oliver Pahl - created -
Since 2008, I develop the Distributed Smart Space Orchestration System (DS2OS) together with many students. DS2OS is a middleware framework that consists of two parts:
- The Smart Space Store (S2Store) comprises functionality to deploy and manage services on the distributed heterogeneous nodes of a future smart space.
- The Virtual State Layer (VSL) middleware provides a distributed context store with transparent access and security mechanisms for services.
In this lab we will focus on the VSL.
DS2OS follows a different approach than the previous middleware designs: the Application Programming Interface (API) to all services is fixed. I provides functionality to manipulate context. All service-specific functionality is stored in the context Model of a service.
DS2OS does not differentiate between driver or smart device adaptation functionality and
other functionality such as orchestration. All services are equal and all functionality
is provided via services in DS2OS.
This facilitates the service design, as developers only have to learn programming the
system once and can create drivers and orchestration workflows then in a similar way. It
also allows to extend the VSL middleware core via regular services similar to the extension
of µ-kernels in modular operating systems. Because of this property, the VSL is called
a µ-middleware.
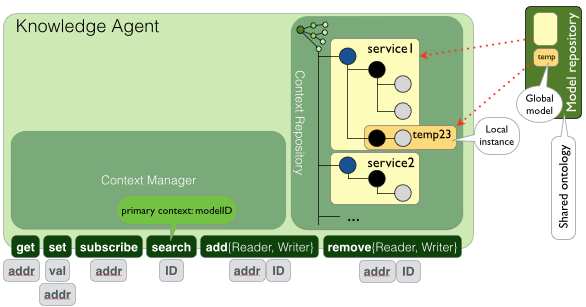
The fixed API and the local context that contains the instantiations from the service models from the global repository [Pahl2013].
2013-12-07 23:25:14: Marc-Oliver Pahl
2013-12-07 23:24:34: Marc-Oliver Pahl
2013-12-07 23:12:32: Marc-Oliver Pahl
2013-12-07 23:10:06: Marc-Oliver Pahl
...
The following poster shows the components of DS2OS. The level of abstraction raises from bottom to top. Smart devices may represent a state as a simple bit mask on the lowest layer.
- Smart Gateway Services do the bidirectional adaptation between the smart device and its context Model in the VSL.
The VSL provides context storage and makes the retrieval from and access to so-called Knowledge (context instances) on the distributed nodes of a Smart Space transparent to services. On top of the VSL different services such as:
- Advanced Reasoning Services that consume context and derive new knowledge from it (e.g. "5000 Lux outside" leads to the inference "it is day")
- Orchestration Services that realize pervasive computing workflows.
- User Interface Services that offer user interfaces on behalf of the distributed devices that often do not have user interfaces, e.g. as they are embedded systems.
For exchanging context Models and services, DS2OS has a central Smart Space Store that contains a repository for the context Models (Model Repository) and for services and their meta data.
Have a look at the poster by clicking on it.
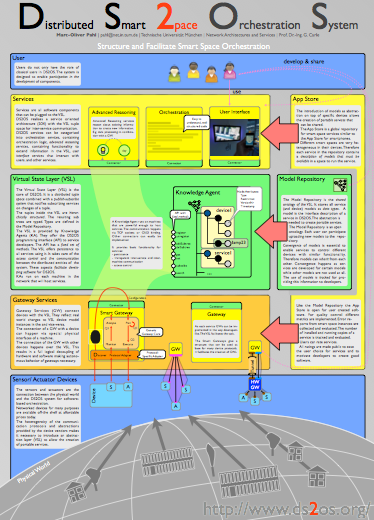
Following the main entities of the poster are explained more detailed.
2013-12-07 23:32:05: Marc-Oliver Pahl
2013-12-07 23:31:18: Marc-Oliver Pahl
2013-12-07 23:31:01: Marc-Oliver Pahl
2013-06-26 23:39:38: Marc-Oliver Pahl
...
Get an overview of the VSL concepts in [14].
2013-12-07 23:26:47: Marc-Oliver Pahl
2013-12-07 22:13:19: Marc-Oliver Pahl
2013-06-27 00:07:51: Marc-Oliver Pahl
2013-06-27 00:06:49: Marc-Oliver Pahl - created -
...
VSL context Models consist of hierarchically structured tuples. A VSL tuple consists of a key-value pair and metadata such as the access rights, the version number or the time, the value was set.
2013-12-08 02:19:24: Marc-Oliver Pahl
2013-12-08 02:18:03: Marc-Oliver Pahl - created -
Shared Abstraction (Model Repository)
Models are the abstract interfaces of DS2OS services. A Model specifies the interaction nodes of a service.
To realise a service oriented architecture (SOA) and to allow distributed development of services it is necessary to share the abstract interface definitions of the different services that run in a space. As devices are connected via services this includes the interfaces to the devices.
The shared abstraction of DS2OS is called Model Repository.
The Model Repository contains typed (named) trees, called Model, that represent the interfaces of the services.
2013-12-08 02:01:06: Marc-Oliver Pahl
2013-06-26 23:43:40: Marc-Oliver Pahl
2013-06-26 23:41:30: Marc-Oliver Pahl - created -
Data Types / Multi-Inheritance
The data type of a DS2OS node indicates, which functionality is available in the subtree.
A model for a light is defined as follows:
lamp.xml:
<lamp>
  <isOn type="/lighting/lightState" reader="*" writer="*"></isOn>
</lamp>

lighting/lightState.xml:
<lightState type="/derived/boolean"></lightState>

derived/boolean.xml:
<boolean type="/basic/number" lowerBound="0" upperBound="1">0</boolean>

basic/number.xml:
<number lowerBound="" upperBound=""></number>
The reader and writer attributes in the lamp Model
specify who may access the node. By default only the creator of the instance (your
Gateway Service) has full access to the nodes. Defining additional access rights for
* means that any ID can access the node.
Note that the boolean type is initialized with 0 in the listing above. The rule is that
later includes overwrite earlier ones. So if the lamp Model would set a
default value 1 for isOn, an instance of it would have the default value 1
set.
Types are used as primary context of the VSL, meaning that instances are identified
by their type. When a node is of the shown type lamp, a service
accessing the node knows automatically that the node will have a subnode isOn
of type /lighting/lightState.
The sharing of Models over the global Model Repository allows service developers to look up
which Models they want to use, and how they can interface them. Using types as primary
context realizes a locator-id-split, meaning that searching for the identifier which is the
type returns a pointer to the locator which is the instance in the concrete smart space.
The access to the lamp functionality over the lamp interface makes the used
context independent of the service implementation that realizes the adaptation. This way
Smart Gateway Services from different developers and for different physical lamps can be
used transparently as they all offer the same interface. This realizes portability
in DS2OS.
Types have two purposes in DS2OS:
- Tagging a node with a data type such as
/basic/number. - Adding a semantic type to a node such as adding
/lighting/lightStateto the derived type/derived/boolean.
This multi-use make multi inheritance necessary. Multi inheritance additionally helps
converging functional interfaces as different sub types of a thing can inherit from a base
type. A dimmableLamp inherits the type lamp for instance and
extends it with additional fields. Tis way, services that are programmed to access lamps
can automatically access dimmable lamps as well. feature is also useful when a Model
as should represent aggregated
2013-12-08 15:55:48: Marc-Oliver Pahl
2013-12-08 15:54:23: Marc-Oliver Pahl
2013-12-08 15:52:24: Marc-Oliver Pahl
2013-12-08 15:51:29: Marc-Oliver Pahl
...
Virtual State Layer
The Virtual State Layer (VSL) is the middleware of DS2OS.
It is a distributed tuple space combined with a publish-subscribe system that notifies subscribing services on changes of a tuple.
The VSL is provided by so-called Knowledge Agents (KA). They offer the DS2OS programming interface (API) to service developers.
The VSL offers the functionality storage, communication, security, and access control to all services using it.
2013-06-26 23:42:25: Marc-Oliver Pahl
2013-06-26 23:41:29: Marc-Oliver Pahl - created -
Asynchronous access: get/ set/ subscribe
Many tasks when orchestrating a smart space are asynchronous: a producer produces information, e.g. a sensor value is read by a Smart Gateway Service from a smart device, and stored in the corresponding node in the service's model in the VSL.
Another service can now access the knowledge using the VSL get and
set methods to the address of the node. The address can be identified using
the search command and the type of the node.
Additionally, a service can subscribe to a node. To do so it registers a callback on an
address. The soon a node in the subtree changes, the callback function is invoked and the
address of the node is passed so that it can be queried using the get method.
This two-step value update mechanism is chosen as service may only sparsely be interested
in the actual values and the values may be big, causing unnecessary traffic.
The callback is registered using the connector c as follows:
c.subscribe(myKnowledgeRoot + "/tickle", new ISubscriber() {
    @Override
    public void notificationCallback(String address) {
      // read the node's data
      if (c.get(myKnowledgeRoot + "/tickle/value").equals("1")) {
          // Someone is tickling us
          h.tickleHandler();
      }
    }
});
As the example shows, adding /value can be used to access the plain value. If it is not added, the XML representation of the node with enclosing tags is returned.
All data in the VSL is passed as String.
2013-12-08 02:33:07: Marc-Oliver Pahl
2013-12-08 02:32:06: Marc-Oliver Pahl
2013-12-08 02:31:55: Marc-Oliver Pahl
2013-12-08 02:30:14: Marc-Oliver Pahl
...
Synchronous Access: Virtual Nodes
Time critical service functionality, or functionality that provides external items on demand require synchronous interaction. Therefore, the VSL offers so-called Virtual Nodes.
The Model of a Virtual Node is as follows:
<virtualNode>
    <serviceId type="/system/serviceID"></serviceId>
</virtualNode>
The type /system/serviceID gets automatically added to a node when it is
declared as virtual by registering the Virtual Node callbacks as described below. So you
do not have to declare a node as virtual in the model of your services by adding
the /system/serviceID type.
Virtual Nodes are not served from the VSL context store but directly passed to the
service they belong to. Though the handling mechanism is different, the interface remains
the same: Virtual Nodes are accessed via get and set.
For making a node in its context Model a Virtual Node, a program registers a callback that is called synchronously (blocking call) on access.
The Virtual Node callbacks can be registered and implemented as follows:
c.registerVirtualNode("/address/where/the/virtualNode/is",
        new IVirtualNodeHandler() {
                @Override
                public void set(String address, String value, String writerID) {
                        // will be called when a set-request for the virtual node is received
                }

                @Override
                public String get(String address, String readerID) {
                        // will be called when a get-request for the virtual node is received
                        return null;
                }
        }
);
The callbacks and the addresses they are registered for are stored in the Knowledge Agent. The callback is called as described when a get- or set-access to a Virtual Node happens.
2013-12-08 02:41:45: Marc-Oliver Pahl
2013-12-08 02:38:30: Marc-Oliver Pahl
2013-12-08 02:34:12: Marc-Oliver Pahl
2013-12-08 02:33:54: Marc-Oliver Pahl
...
Virtual Subtrees
The VSL handles Virtual Nodes like virtual subtrees. If additional information is added in
the path after the Virtual Node, the full address is passed to the subtree. As an example
one could call get "/greet/Luke Skywalker" to access the Virtual Node
/greet. In the following example, in the get handler
implementation everything behind the node name is extracted and passed as argument to the
handler:
        // The registration of the /greet node.
        c.registerVirtualNode(myKnowledgeRoot + "/greet", new IVirtualNodeHandler() {
            // Greet the posted name to the std::out. Ignore added suffixes.
            @Override
            public void set(String address, String value, String writerID) {
                h.greetConsole(value + "!");
            }

            // Greet the suffixed name by returning the greeting.
            @Override
            public String get(String address, String readerID) {
                String suffix = address.substring((myKnowledgeRoot + "/greet/").length());
                return h.greetBack(suffix);
            }
        });
2013-12-08 02:49:45: Marc-Oliver Pahl
2013-12-08 02:49:02: Marc-Oliver Pahl
2013-12-08 02:47:18: Marc-Oliver Pahl
2013-12-08 02:44:16: Marc-Oliver Pahl - created -
...
The goal of the DS2OS architecture is to facilitate the creation of smart space services. A major methodology applied is creating a Service Oriented Architecture (SOA). Complex functionality is modularized into small and simple parts that get connected over their standardized VSL interfaces.
A DS2OS service package consists of three elements:
- The VSL context Model that describes the context nodes, a service offers as its abstract interface.
- The service executable that contains the service implementation.
- A manifest that contains access rights and dependencies of the service.
In this lab we will have a look at the former two.
2013-12-07 23:41:18: Marc-Oliver Pahl
2013-12-07 23:36:39: Marc-Oliver Pahl
2013-06-27 00:17:10: Marc-Oliver Pahl
2013-06-27 00:15:53: Marc-Oliver Pahl
...
Services
Services are all software components that can be plugged to the VSL. Each entity in DS2OS is a service and has a model. This applies for smart device hardware too as it is connected to the VSL via Smart Gateway Services.
DS2OS services can be categorised into
- driver services, that connect hardware to the VSL abstraction,
- orchestration services, containing orchestration logic,
- advanced reasoning services, containing functionality to extend information in the VSL,
- user interface services that interact with users, and
- other services.
The special property of driver services is that they have two interfaces: a proprietary one to the hardware and the regular interface to the middleware. The unification of the middleware interface of device driver services facilitates their programming.
Smart spaces need many services to support as many devices (smart gateway) and pervasive computing work flows (orchestration).
2013-12-07 23:26:06: Marc-Oliver Pahl
2013-12-07 23:25:59: Marc-Oliver Pahl
2013-06-26 23:45:55: Marc-Oliver Pahl
2013-06-26 23:41:30: Marc-Oliver Pahl - created -
...
Smart Space Store (S2Store)
Similar to the App Store for smartphones, the Smart Space Store (S2Store) offers services for smart spaces. It provides a global repository for services, their abstract models, and their manifests.
The S2Store is not part of this lab.
2013-06-26 23:46:31: Marc-Oliver Pahl
2013-06-26 23:41:31: Marc-Oliver Pahl - created -
Smart Gateway Services (SGW) connect smart devices with their virtual representation in the VSL. This adaptation is done in both directions, changes on the device are reflected to the Model instance and changes in the context of the device in the VSL are reflected to the device.
As we have seen in the architecture,
services typically communicate in an asynchronous
way. An orchestration service sets the context node
/agentId/serviceId/isOn to 1, the SGW has subscribed to the node,
gets a notification, queries
the value and tries to reflect it to the remote controlled lamp. As there is no
synchronous connection between the SGW and other services, the SGWs have to operate
autonomously. This makes the overall design of a DS2OS site less complex again as it
encapsulates all device related functionality in the SGW.
The lose coupling of services makes it necessary to have Autonomous Smart Gateways. For realizing autonomous behaviour it becomes necessary to distinguish between a desired and a running state as follows:
- For each node that results in a change on the connected device, the Smart
Gateway creates a sub node
/desiredof the same type as its parent. E.g./lamp/isOn/desired. - The Smart Gateway subscribes all its desired nodes.
- A Service sets the desired state of a desired node in the abstraction in the VSL.
- The Smart Gateway receives a callback. The callback method handles the desired state change by trying to reflect the value of the desired node to the device.
- Afterwards the current state of the device is reflected onto the parent node.
For example:
- A service sets
/lamp/isOn/desiredto TRUE. The value of the node/lamp/isOnis currently FALSE. - The Smart Gateway tries to switch the lamp on.
- Afterwards it checks the current state of the physical lamp and stores the result into
/lamp/isOn. - If it was successful
/lamp/isOnand/lamp/isOn/desiredare both TRUE now.
The Smart Gateway tries to keep the virtual representation of the lamp and its physical reality consistent.
2013-12-08 13:18:00: Marc-Oliver Pahl
2013-12-08 13:15:25: Marc-Oliver Pahl
2013-07-02 22:53:55: Marc-Oliver Pahl
2013-07-02 22:52:37: Marc-Oliver Pahl
...
Connectors
The VSL uses XML RPC for communication. To facilitate the development of services, native connectors to different programming languages are provided. The connectors encapsulate the communication with the VSL so that service developer so not have to care about it.
2013-12-08 03:03:57: Marc-Oliver Pahl
2013-12-08 03:03:38: Marc-Oliver Pahl
2013-12-08 03:00:59: Marc-Oliver Pahl
2013-12-08 03:00:06: Marc-Oliver Pahl
...
Java Connector
To facilitate the creation of Java services, a so-called Java-connector and a service template are provided. See figure 7 for the architecture of a DS2OS Java service.
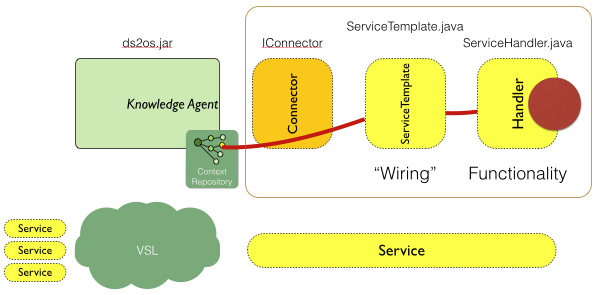
Fig. 7: The service template classes, the connector, and a Knowledge Agent that offers the interface to the VSL.
The connector offers native Java methods to communicate with the VSL. The proposed design is to use one class (ServiceTemplate.java) for the "wiring", and one class (ServiceTemplateHandler.java) for implementing the functionality. Wiring means registering the callbacks from the VSL and sending the data to the handler.
Advantage of separating the two functionalities are that you have a smaller file that shows you all handlers, and that you can write Unit tests for your handler class without having to care about the VSL functionality.
The Java connector is invoked as shown in Fig. 8. On registration, the VSL creates a subtree with the service's ID and initializes the subtree with the given model that is loaded from the Model Repository. The figure shows how the full address of the service's subtree can be obtained.
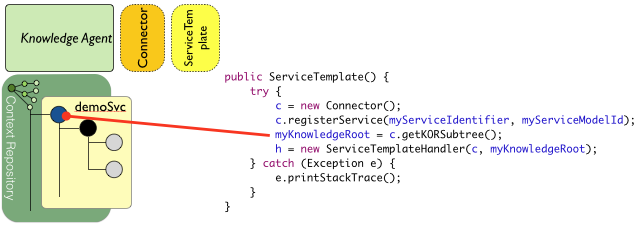
Fig. 8: Invoking the Connector.
2013-12-08 01:58:26: Marc-Oliver Pahl
2013-12-08 01:54:38: Marc-Oliver Pahl
2013-12-08 01:53:23: Marc-Oliver Pahl
2013-12-08 01:51:31: Marc-Oliver Pahl - created -
...
Application Programming Interface
For service programmers connectors to different programming languages are offered. We will use the Java connector.
You can find the API documentation of the connector to the KA here.
Following the wiring code of the tamplate is shown:
public class ServiceTemplate {

    /**
     * The local Id that is used for your service:
     */
    private static final String myServiceIdentifier = "demoService";

    /**
     * The model that is used for your service.
     */
    private static final String myServiceModelId = "/services/template/demoService";

    /**
     * The connector instance used by this service.
     */
    private Connector c;

    /**
     * The class where your functionality is implemented.
     */
    private ServiceTemplateHandler h;

    /**
     * Stores the sub tree root that is belonging to this service.
     */
    private String myKnowledgeRoot;

    /**
     * You can use the logger for logs.
     */
    private static final Logger LOGGER = LoggerFactory.getLogger(ServiceTemplate.class);

    /**
     * The constructor that creates a connector instance and tries to register to a local agent
     * instance. TODO: Give your service a speaking name.
     */
    public ServiceTemplate() {
        try {
            c = new Connector();
            c.registerService(myServiceIdentifier, myServiceModelId);
            myKnowledgeRoot = c.getKORSubtree();
            h = new ServiceTemplateHandler(c, myKnowledgeRoot);
        } catch (Exception e) {
            e.printStackTrace();
        }
    }

    /**
     * To know which nodes exist have a look at the model specified with the Id in myServiceModelId.
     * TODO: Change to connect to your subscription handlers
     * @throws AgentErrorException
     * @throws AgentCommunicationException
     */
    public void registerSubscriptions() throws AgentCommunicationException, AgentErrorException {
      // TODO: add your subscription handlers here
    }

    /**
     * To know which nodes exist have a look at the model specified with the Id in myServiceModelId.
     * TODO: Change to connect to your subscription handlers
     * @throws AgentErrorException
     * @throws AgentCommunicationException
     */
    public void registerVirtualNodeHandlers() throws AgentCommunicationException,
            AgentErrorException {
      // TODO: add your Virtual Node handlers here
    }

    /**
     * This method disconnects your service from the local agent.
     */
    public void shutdown() {
        LOGGER.info("Shutting down...");
        c.shutdown();
    }

    /**
     * The main method executes your service.
     */
    public static void main(String[] args) {
        ServiceTemplate s = new ServiceTemplate();
        try {
            s.registerSubscriptions();
            s.registerVirtualNodeHandlers();
        } catch (AgentCommunicationException e1) {
            LOGGER.error("We caught a communication error: {}", e1.getLocalizedMessage());
            e1.printStackTrace();
        } catch (AgentErrorException e1) {
            LOGGER.error("We caught an agent error: {}", e1.getLocalizedMessage());
            e1.printStackTrace();
        }

        // We will just wait here until the user sends us a "q" [return]
        BufferedReader in = new BufferedReader(new InputStreamReader(System.in));
        String quitString;
        try {
            do {
                System.out.println("Type q to end this service.");
            } while ((quitString = in.readLine()) != null && !quitString.equals("q"));
        } catch (IOException e) {
            e.printStackTrace();
        }
        s.shutdown();
    }
}
2013-12-08 03:08:35: Marc-Oliver Pahl
2013-12-08 03:07:22: Marc-Oliver Pahl
2013-07-08 11:30:34: Marc-Oliver Pahl
2013-06-27 00:16:11: Marc-Oliver Pahl
...
2013-06-27 00:46:19: Marc-Oliver Pahl
2013-06-27 00:44:49: Marc-Oliver Pahl - created -
9.1. Do-It-Yourself Movement
From the early times of software people are creating and sharing software in a crowdsourced way. Since 1998 the open source movement exists as a way to channel the creation on open or free software. With the emergence of smartphones and the opening of the App Store to third party applications (Apps) in 2008, crowdsourced software development was pushed and commercialized more.
Similar to crowdsource software development, crowdsourced hardware development exists. In 2005 the Arduino project was started. Similar projects are the Raspberry Pi, the Beaglebone, and others. The cheap hardware with its development kits allows hobby developers to create their own Do-It-Yourself (DIY) hardware.
DIY hardware is very interesting for creating smart spaces. The platforms allow to make non-smart hardware smart by adding the embedded device that brings a network connection.
In this lab we will not only look at the software part of smart space orchestration but also at the hardware part. The service oriented design of DS2OS in combination with the abstract interfaces provided by the VSL models allow you to build and integrate your own DIY smart devices easily as you will see in the lab.
The focus of the lab is on DS2OS and not on the Arduino. We will connect some sensors and actuators to the Arduino in the lab and make them accessible from remote. As you may be interested in more background about the Arduino project, we provide you with further information here.
2013-12-08 13:35:49: Marc-Oliver Pahl
2013-12-08 13:35:32: Marc-Oliver Pahl
2013-12-08 13:33:22: Marc-Oliver Pahl
2013-12-08 13:20:56: Marc-Oliver Pahl
...
What is the Arduino platform and what can I do with it?
General Information
 " Arduino is an open source hardware platform with a focus on
easy prototyping. The first Arduino - the Arduino Uno - was developed in 2005 as an easy to
use microcontroller board that is less expensive than the available alternatives at that
time. Since then several other boards widened the Arduino family. Except for the Arduino
Due, all Arduinos use an 8-bit Atmel AVR microcontroller, the Due uses a 32-bit
micorcontroller.
" Arduino is an open source hardware platform with a focus on
easy prototyping. The first Arduino - the Arduino Uno - was developed in 2005 as an easy to
use microcontroller board that is less expensive than the available alternatives at that
time. Since then several other boards widened the Arduino family. Except for the Arduino
Due, all Arduinos use an 8-bit Atmel AVR microcontroller, the Due uses a 32-bit
micorcontroller.
Typical for microcontroller boards like the Arduino is a relatively low power consumption and low resources in regards of CPU power and memory. The Arduino also provides digital IO-pins, some of which are PWM capable, as well as analog input pins. Some pins can be used to fire interrupts. The Arduino also supports some common protocols, for example SPI, i2c and RS232.
A key feature of the Arduino boards are easy to access IO-pins, which on most boards have a similar layout. This also allows the functionality of the boards to be extended by add-on modules called 'shields'. Typical tasks for such shields are to provide connectivity (ethernet, wifi, zig-bee), motor control, and GSM. Given the open platform and fixed layout, a lot of third-party shields are available. Most software libraries for these shields are open source too.
Example applications
- Mechanical bass: Youtube (1), Youtube (2)
- M&M sorting machine: Youtube
- Lightning controller: Youtube
- Hexapod robot: Youtube
- HTML5 canvas plotter: Youtube
- Bird Buggy: Youtube
- Gardening system: www.instructables.com
2013-06-25 10:42:56: Johann Dichtl
2013-06-25 10:42:31: Johann Dichtl
2013-06-25 10:41:58: Johann Dichtl
2013-06-24 16:17:50: Johann Dichtl
...
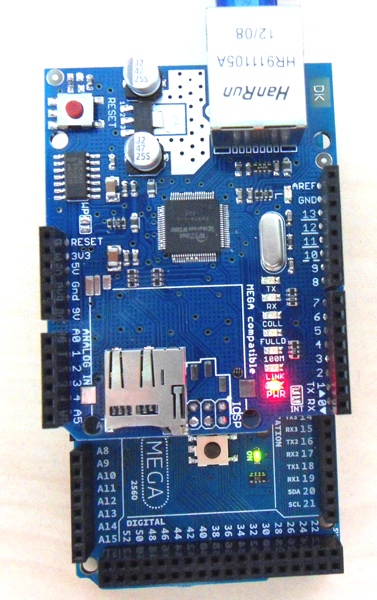
" In the lab course we use the Arduino Mega 2560 with an ethernet shield. The Arduino Mega is
clocked at 16 MHz, has 8 kB of SRAM, 258 kB flash memory for storing code and 4 kB EEPROM
for persistent data storage. It is also pre-loaded with a bootloader to allow easy upload
of code via the usb cable.
The official specifications for the Arduino Mega can be found at arduino.cc/en/Main/ArduinoBoardMega2560.
The analog pins are located on the left side, the digital ones on the right and at the bottom. Power, USB and Ethernet are connected from the top. The red button in the top left corner is a reset button. Pressing it will cause the Arduino to reset and startup the application again. Doing so does not harm the Arduino, neither does removing the power supply or ethernet cable. When connected via USB, an additional power supply is usually not needed.
The digital pins provide 5V (when configured as digital output in a HIGH state) and support up to 40 mA per pin.
The analog pins support a 10bit resolution between 0V (analog read value: 0) and +5V (analog read value 1023) input.
Close to the top left of digital pin 13 is an on-board LED which is connected to pin 13. We will use it a few times as an easy-to-use LED in our demo programs. This LED will also blink rapidly while uploading the compiled code.
2013-06-25 10:51:35: Johann Dichtl
2013-06-25 10:50:57: Johann Dichtl
2013-06-25 10:49:23: Johann Dichtl
2013-06-25 10:47:09: Johann Dichtl
...
What will be done in the lab?
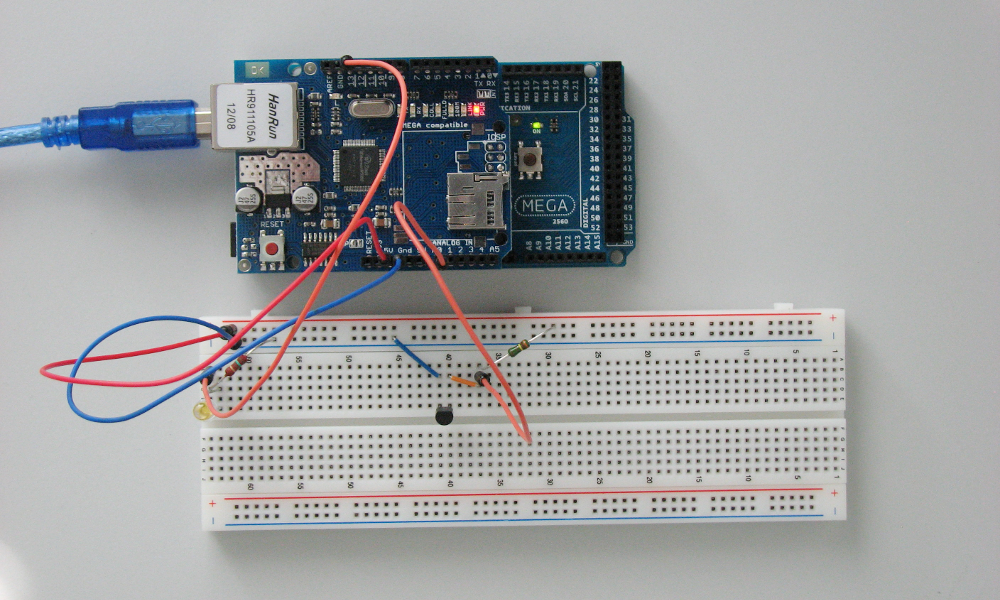
In the lab we will create our own smart device hardware, and we will write a "firmware" that runs on the Arduino and makes its functionality accessible from remote. Your smart device may look as shown in the figure.
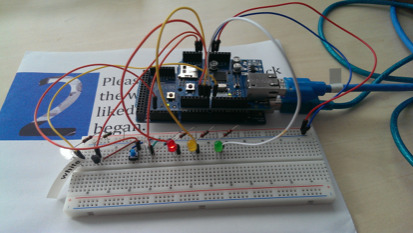
A smart device built by an iLab2 team in 2013.
We will give you some information about the hardware prototyping next. You will get all the requires equipment at the secretaries office. Please by cautious not to damage the hardware and bring it back to the secretaries office after use. Thank you!
2013-12-08 13:41:01: Marc-Oliver Pahl
2013-12-08 13:37:57: Marc-Oliver Pahl - created -
Prototyping with a Breadboard
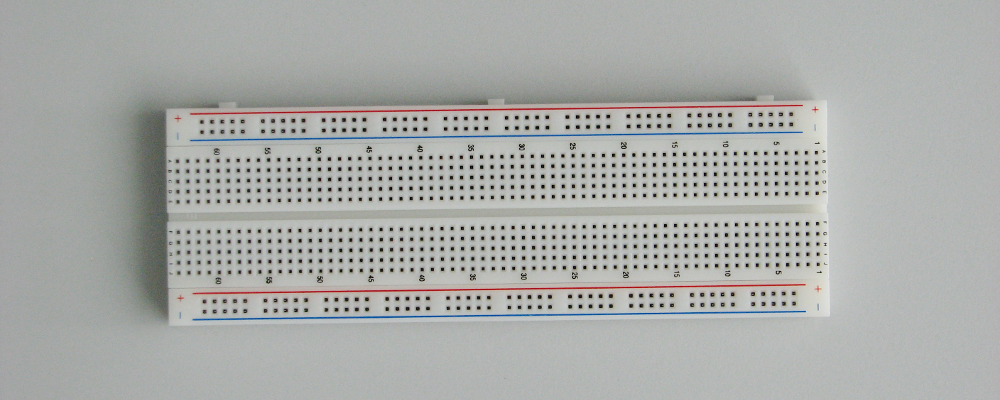
Prototyping with Arduinos is typically done with breadboards. A breadboard is solderless plugboard that allows to set up and change the wiring of the project by using jumper wires. That way projects can be tested without any soldering, enabling to try out multiple configurations in a short time.
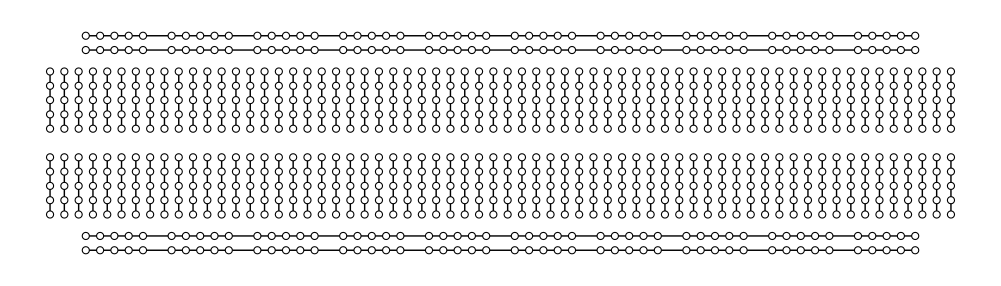
2013-07-02 22:14:26: Marc-Oliver Pahl
2013-07-02 22:13:10: Marc-Oliver Pahl - created -
Collection on tutorials and projects
- How to make a Physical Gmail Notifier: Jamie Matthews
- Breadboard and LED tutorial: www.ladyada.net
- Analog read tutorial: arduino.cc
- Read commands from serial connection: arduino.cc
- TCP chat server: arduino.cc
- Rebuild an Arduino on a breadboard: arduino.cc
What do I find here?
On the following pages you find pictures and instruction on how to connect the different sensors and actuators to your arduino Smart Device. You can use and combine those components in the lab part later as you like.
The following pages are also meant as reference manual for you during the lab later. So come back when you do the lab.
2013-12-08 13:43:46: Marc-Oliver Pahl
2013-07-02 22:11:10: Marc-Oliver Pahl
2013-06-12 11:07:35: Marc-Oliver Pahl
2013-06-11 23:02:12: Marc-Oliver Pahl
...
2013-06-19 15:11:11: Marc-Oliver Pahl
2013-06-19 15:10:45: Marc-Oliver Pahl
2013-06-19 15:10:04: Marc-Oliver Pahl
2013-06-19 15:09:40: Marc-Oliver Pahl
...
Resistors
Resistors are used to restrict the current and/or voltage in a circuit, following the formula U = R * I. The resistors that we use in the lab have the typical color coding that indicates their resistance. The colors are printed on the resistor as rings. There can be three, four, five or six rings, the resistors in the lab have either four or five. With four rings, the first two rings define the digits, the third ring a multiplier, and the last ring the tolerance. If the resistor has five rings, than the first three rings are used for the digits, the other follow as for the four-ringed resistors. The values that are associated with the colors can be looked up in tables. Often one of the rings is a bit thicker or has a greater distance to the other rings. In that case this is the right-most ring, indicating the order at which the rings should be read.
Numerous smartphone apps and web-applications exist that help to calculate the resistance for a given color-coding. One example is found at www.hobby-hour.com/electronics/resistorcalculator.php. Feel free to use it if you're unsure about the resitance of a given resistor.
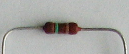
In the lab we use the following resistors:- 150Ω (brown, green, brown, gold)
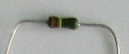
- 3240Ω (orange, red, yellow, brown, brown)
- The resistor from the question below...
2013-06-25 11:28:54: Johann Dichtl
2013-06-25 11:27:24: Johann Dichtl
2013-06-25 11:26:56: Johann Dichtl
2013-06-25 11:26:15: Johann Dichtl
...
2013-07-02 16:16:16: Marc-Oliver Pahl
2013-07-02 16:15:57: Marc-Oliver Pahl
2013-07-02 16:13:41: Marc-Oliver Pahl - created -
Light Emitting Diode
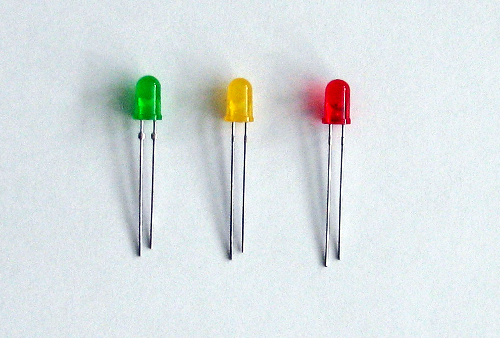
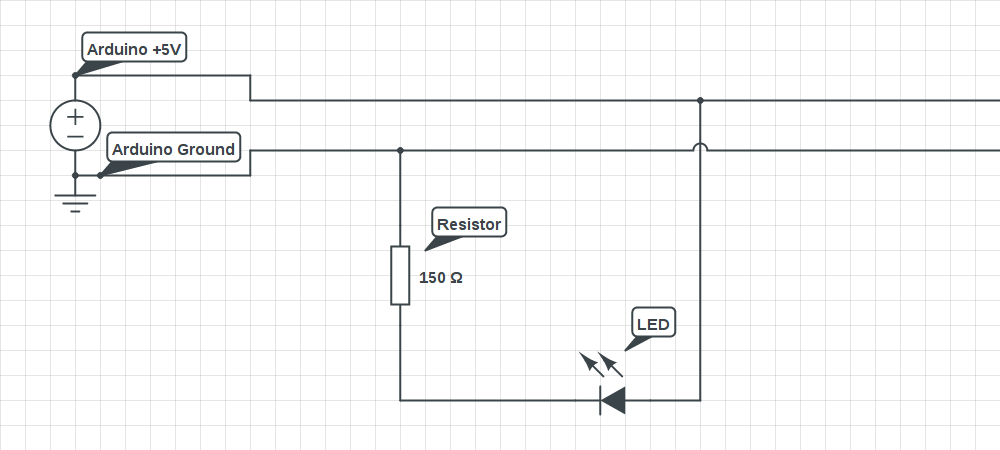
LEDs are used in the lab as an easy-to-use visual output. They are - as the name already indicates - diodes, which means that they allow current flow in only one direction. Applying too much voltage to an LED (in any direction) will damage the LED. So, in order to protect an LED it is usually connected with a resistor (in series). The longer pin of the LED is the anode (positive voltage) and the shorter pin is the cathode (connected to ground)LEDs have a relatively high initial resistance until a certain voltage is met, typically around 2 to 3V. Above that voltage resistance drops rapidly, which is part of the reason why we add a resistor in series for every LED that we use in the lab. This characteristic also makes it hard to dim the LED via voltage changes. However LEDs can be turned on and off very quickly, allowing to use pulse width modulation (PWM) to control the brightness by turning it on (to full brightness) for short or longer time intervals.
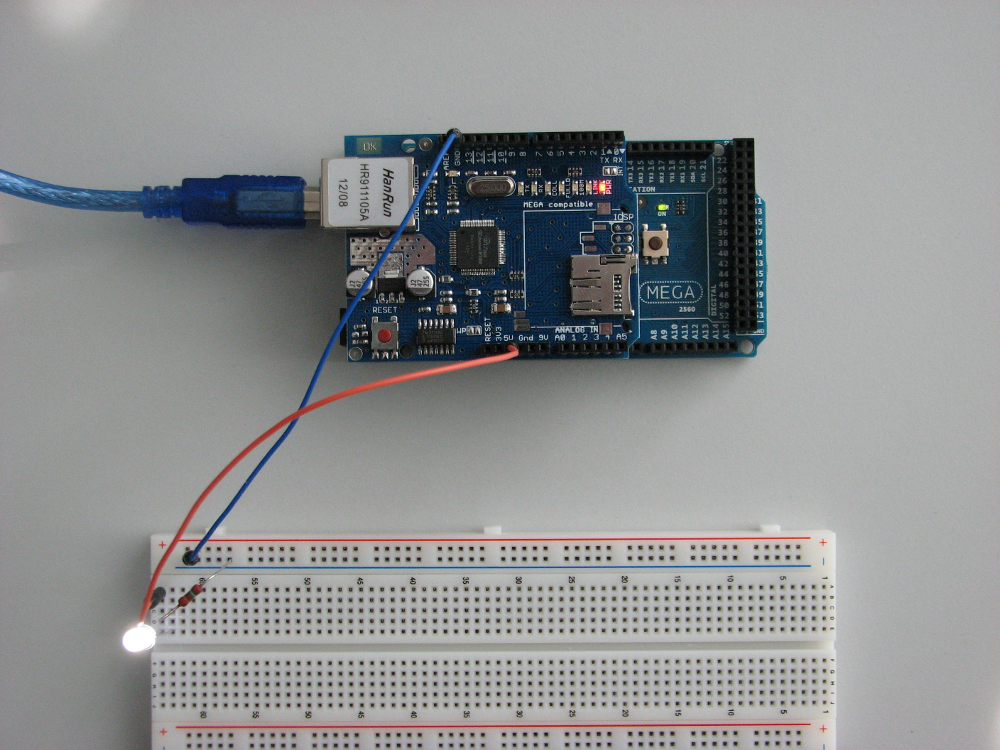
Plugging the hardware on the breadboard
Required parts
- Breadboard
- LED
- 150 Ω Resistor (colors: brown, green, brown and gold)
- Jumper wires
- Arduino Board (used as power source) + USB cable
Circuit diagram
2013-06-25 12:04:11: Johann Dichtl
2013-06-25 12:03:04: Johann Dichtl
2013-06-25 12:01:31: Johann Dichtl
2013-06-25 11:59:54: Johann Dichtl
...
Connecting the device to the Arduino
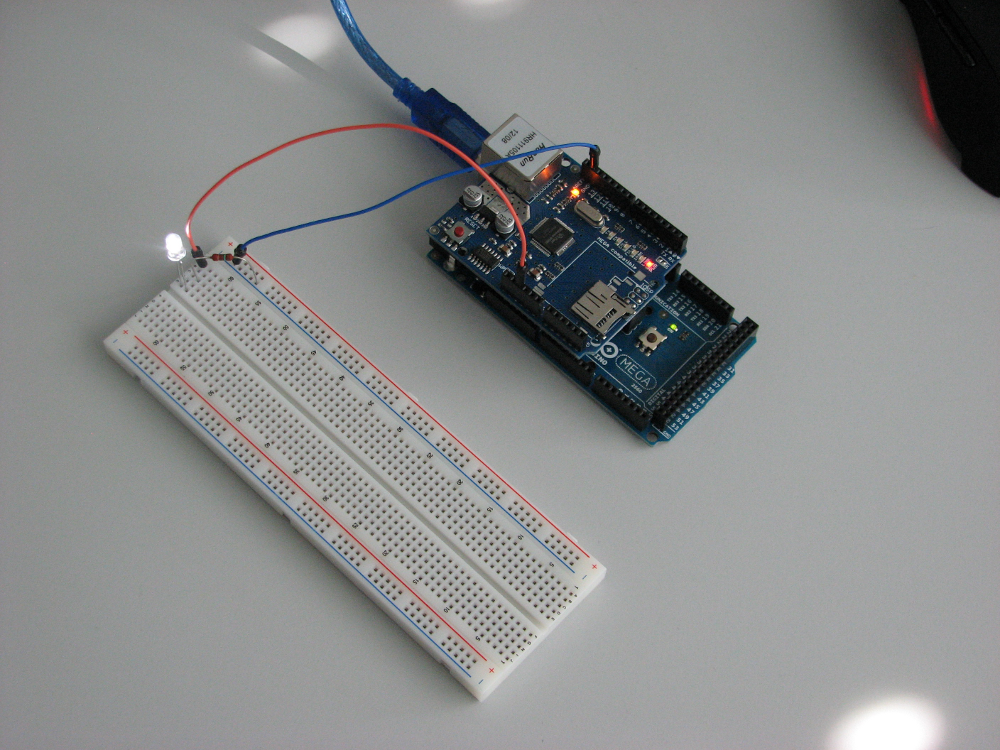
To connect the Arduino and the breadboard, use the flexible jumper wires. To create circuits on the breadboard, we recommend to use the solid core wires.
Be careful to not create a short circuit. Always have a resistor between a power source and a current sink.
2013-06-25 15:22:02: Johann Dichtl
2013-06-25 15:21:47: Johann Dichtl
2013-06-17 15:01:05: Johann Dichtl
2013-06-12 11:43:51: Marc-Oliver Pahl
...
Temperature Sensor
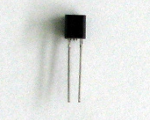 As an analog input source we provide a temperature sensor for the
lab exercises. In our case it is the KTY81 220, a very simple kind of temperature sensor -
a temperature-dependent resistor. Since we cannot measure the resistance directly, we
instead have to measure the voltage via an analog input.
As an analog input source we provide a temperature sensor for the
lab exercises. In our case it is the KTY81 220, a very simple kind of temperature sensor -
a temperature-dependent resistor. Since we cannot measure the resistance directly, we
instead have to measure the voltage via an analog input.
Since we are only interested in a rather small temperature range (from 20 to 30°C), we use a "voltage divider" circuit to increase the difference in voltage in that range. The circuit diagram below shows the setup, including the voltage divider.
Plugging the hardware on the breadboard
Required parts
- Breadboard
- Temperature Sensor (KTY81 220)
- 3.42kΩ Resistor
- Jumper wires
- Arduino
Circuit diagram
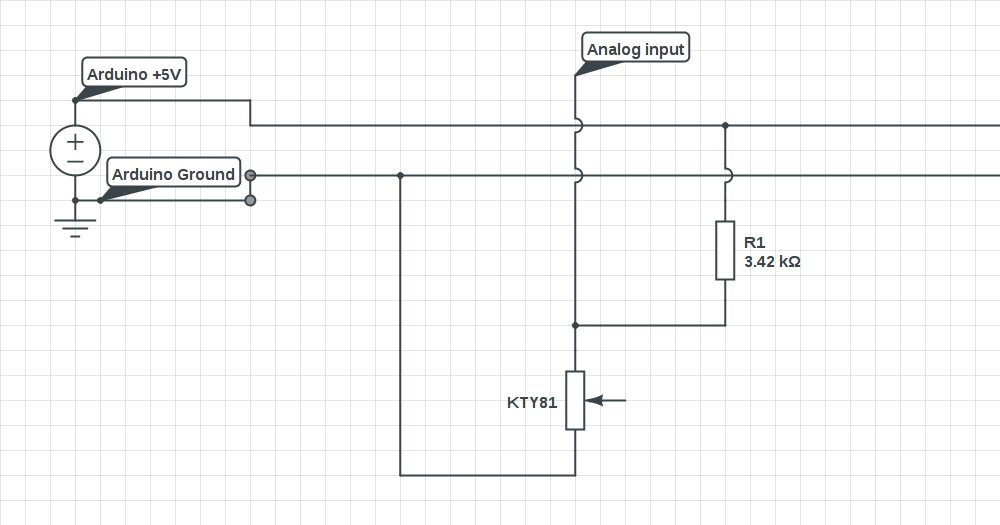
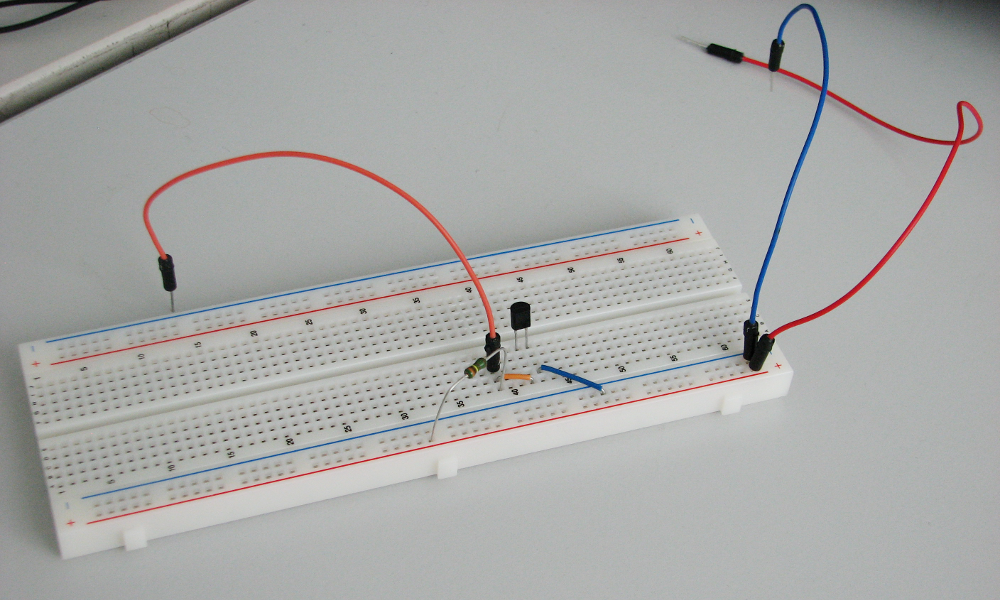
Photo of the setup
2013-06-25 12:32:31: Johann Dichtl
2013-06-25 12:27:49: Johann Dichtl
2013-06-25 12:27:09: Johann Dichtl
2013-06-25 12:23:58: Johann Dichtl
...
Connecting the device to the Arduino
To connect the Arduino and the breadboard, use the flexible jumper wires. To create circuits on the breadboard, we recommend to use the solid core wires.
Be careful to not create a short circuit. Always have a resistor between a power source and a current sink.
2013-06-25 15:22:02: Johann Dichtl
2013-06-25 15:21:47: Johann Dichtl
2013-06-17 15:01:05: Johann Dichtl
2013-06-12 11:43:51: Marc-Oliver Pahl
...
Light Sensitive Sensor
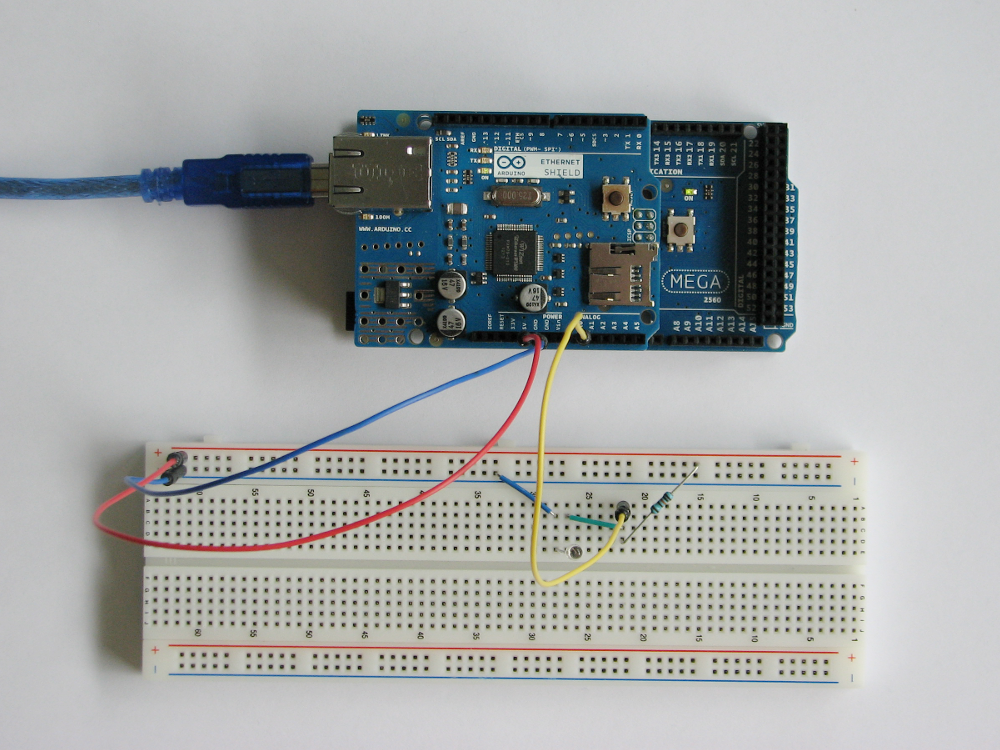
The photo-sensitive sensor used in the lab exercise is a phototransistor, i.e. a transistor that is controlled by a build-in photodiode. For measuring the light intensity, we connect the analog input from the Arduino with a pull-up resistor to +5V power supply, and have the phototransistor to sink the current to the ground. That way, if no light is shining, the phototransistor does not allow any current to pass and we can meassure +5V on the input pin (assuming a perfect circuit). If there is a lot of light shining, the current flows through the phototransistor to the ground, and we measure close to 0V on the input pin. Since the amount of current that can flow thorough the transistor (i.e. its resistance) depends on the amount of light collected by the sensor, we can determine how much light is shining by measuring the voltage at the input pin.
2013-07-06 13:39:28: Marc-Oliver Pahl
2013-07-06 13:39:17: Marc-Oliver Pahl
2013-07-06 13:38:51: Marc-Oliver Pahl - created -
Plugging the hardware on the breadboard
Required parts
- Breadboard
- Phototransistor (SFH 309)
- ~100kΩ Resistor
- Jumper wires
- Arduino
Circuit diagram
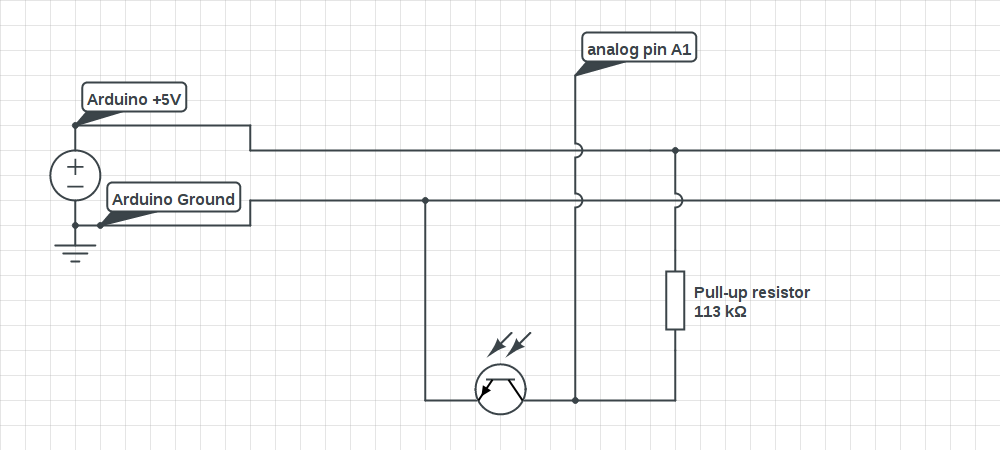
Photo of the setup
Connecting the device to the Arduino
To connect the Arduino and the breadboard, use the flexible jumper wires. To create circuits on the breadboard, we recommend to use the solid core wires.
Be careful to not create a short circuit. Always have a resistor between a power source and a current sink.
2013-06-25 15:22:02: Johann Dichtl
2013-06-25 15:21:47: Johann Dichtl
2013-06-17 15:01:05: Johann Dichtl
2013-06-12 11:43:51: Marc-Oliver Pahl
...
Button
One input source for the exercise is a simple mechanical switch, also referred to as a button. The button used in the lab has four pins, of which two (on the long sides) are permanently connected. When pressed, all four pins are connected, as shown in the figure below. The left circuit shows the button as a symbol, the same way we will use it in circuit diagrams. The circuit in the center of the figure shows the internal layout of the button with respect to all four pins. The photo on the right shows the orientation of the button, as it is used for the circuit in the center.
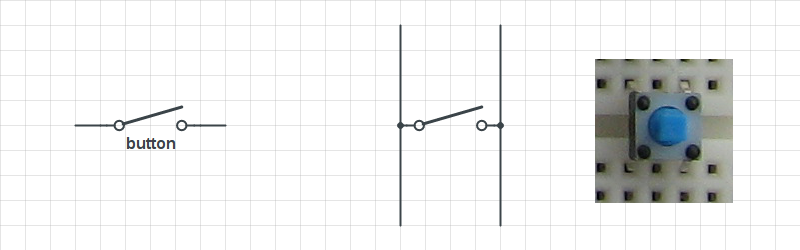
In order to not create a short circuit when the button is closed, the circuit should always contain a resistor between the power source and the input pin. To create a defined state when the button is open, we need an resistor, as shown in the circuit diagram below. This resistor is called a pull-up resistor, if it sets the default state to HIGH (+5V) and pull-down, if it sets the default state to LOW (grounded). Pull-up and pull-down resistors are typically around 10kΩ or higher. The Arduino provides internal pull-up resistors for several of its pins (turned off by default), we use an external pull-up resistor in this example.
Required parts
- button
- resistor: ~10kΩ (we provide a 18.7kΩ resistor that will work)
- jumper wires
- Arduino Mega
Circuit diagram
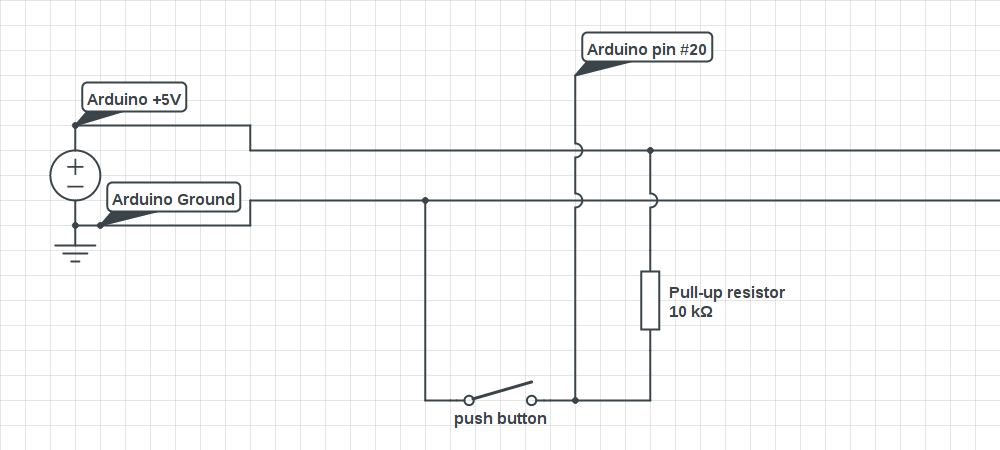
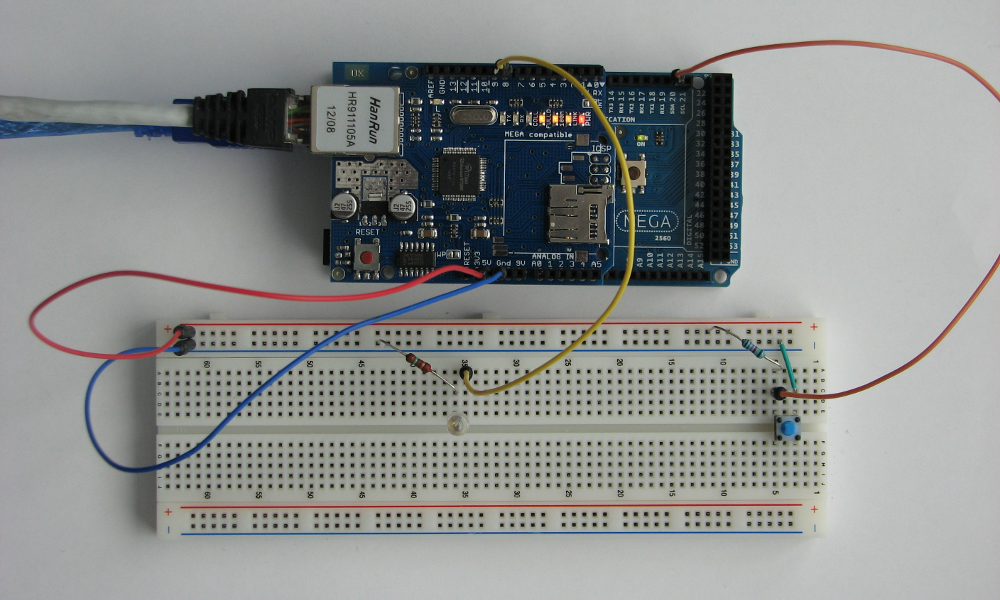
Photo of the setup
Photo of the setup with an additional LED added.
2013-06-25 15:19:38: Johann Dichtl
2013-06-25 15:16:21: Johann Dichtl
2013-06-25 15:12:26: Johann Dichtl
2013-06-25 15:09:55: Johann Dichtl
...
Connecting the device to the Arduino
To connect the Arduino and the breadboard, use the flexible jumper wires. To create circuits on the breadboard, we recommend to use the solid core wires.
Be careful to not create a short circuit. Always have a resistor between a power source and a current sink.
2013-06-25 15:22:02: Johann Dichtl
2013-06-25 15:21:47: Johann Dichtl
2013-06-17 15:01:05: Johann Dichtl
2013-06-12 11:43:51: Marc-Oliver Pahl
...
After having connected the hardware sensors and actuators, we will write a "firmware" for our smart device that makes it remote controllable over network over a proprietary protocol we will develop.
To facilitate software development, the Arduino platform brings an Integrated Development Environment (IDE). If you want to play around with it already, you can download the IDE from the Arduino website (local copy of arduino-1.0.5-linux64.tgz).
2013-12-08 13:46:43: Marc-Oliver Pahl
2013-12-08 13:45:07: Marc-Oliver Pahl - created -
Outline - Software
The Arduino IDE
The Arduino comes with a simple IDE. It provides a text editor and various tools, e.g. a compiler and a serial monitor and an uploader to move the compiled code onto the Arduino. It also comes with several sample applications, some of which will be used in the lab to test the hardware setups. If you don't like the text editor you can write your code in an external editor, such as for example vim or emacs and use the IDE only for compiling and upload.
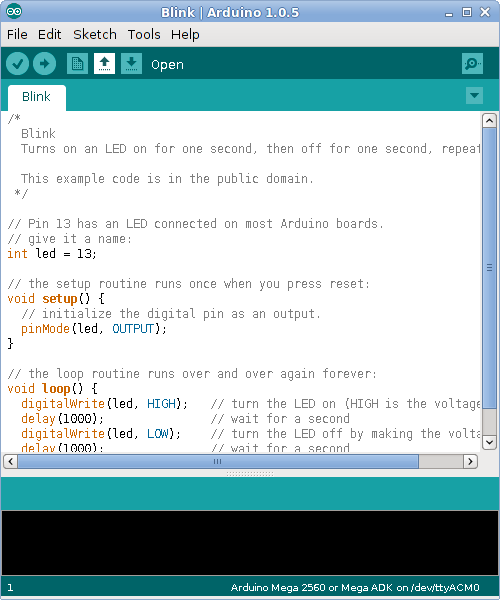
You can find an overview of the basic language features and the provided libraries at arduino.cc/en/Reference/HomePage. The only library that we use is the Ehternet library (and the SPI library as a dependence of the Ethernet library).
 open button instead of the menu: file->open because these two open
different dialogs.
open button instead of the menu: file->open because these two open
different dialogs.
The Arduino homepage also hosts a forum at forum.arduino.cc. There you can find additional information about projects done with arduino, known problems of hard- and software and so on.
2013-06-25 14:28:42: Johann Dichtl
2013-06-25 13:58:58: Johann Dichtl
2013-06-25 13:58:53: Johann Dichtl
2013-06-25 13:58:06: Johann Dichtl
...
10.1. What will we do in the Lab?
Besides looking at the DS2OS peer-to-peer framework for Smart Space Orchestration, and building your own DIY smart device, we will have a look at how software can be evaluated.
We will focus on the performance evaluation and more specifically on latencies and throughput measurements in this lab. Besides other thing, in the lab you should learn, how measurement setups can be done, how data can be collected, how measurements can be evaluated and plotted with gnuplot, and how important it is to have a sufficiently big sample size.
This prelab part will give you an quick reminder on some statistic background.
2013-12-08 14:02:18: Marc-Oliver Pahl
2013-12-08 14:02:01: Marc-Oliver Pahl
2013-12-08 13:49:45: Marc-Oliver Pahl
2013-12-08 13:48:51: Marc-Oliver Pahl - created -
...
Minimum and Maximum values
Assume you obtained an array of N samples. Then the minimum and maximum values are defined as

|
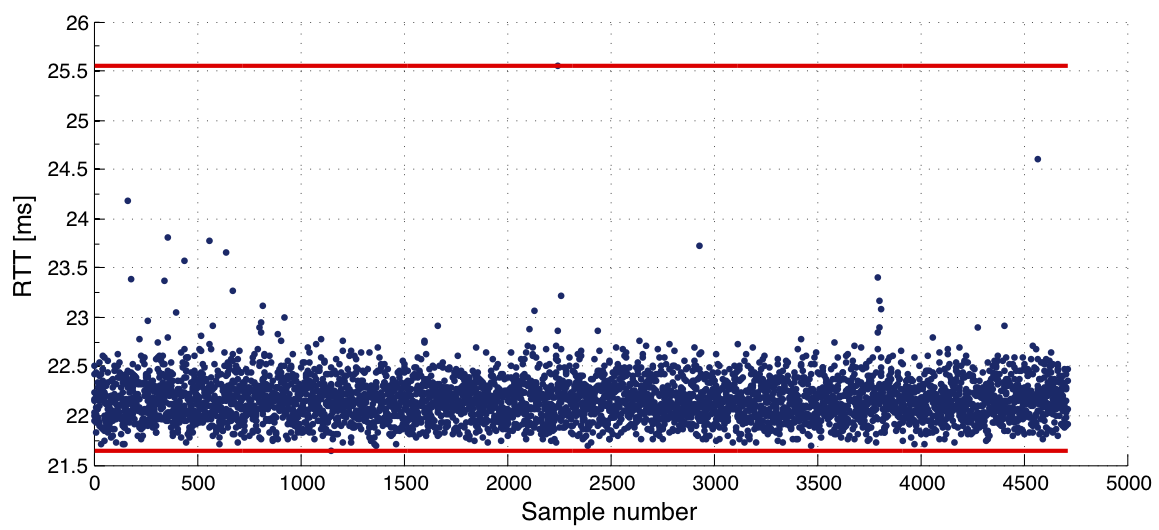
When measuring delays, e.g. RTTs, you are usually interested in the minimum value. The reason is that buffering and processing of packets along a path adds a stochastic delay. The figure below shows RTTs in a scatter plot together with the lines marking the minimum and maximum values observed.
|
2011-07-26 23:24:22: Marc-Oliver Pahl
2011-07-14 11:31:04: Marc-Oliver Pahl
2011-07-14 11:31:04: Marc-Oliver Pahl - created -
Mean value
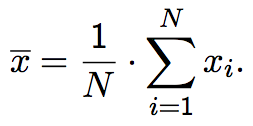
The mean value of N values is given by
|
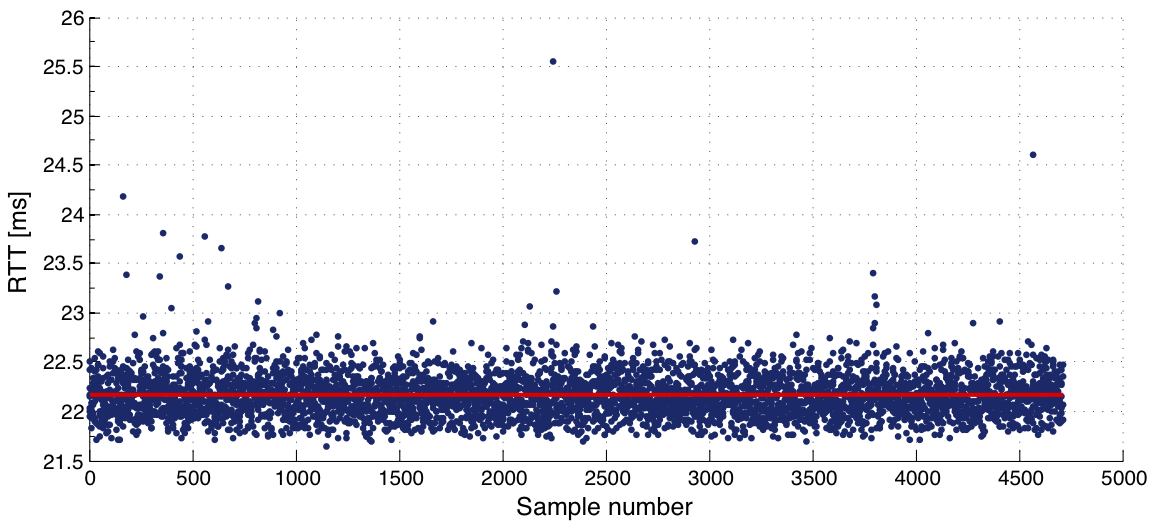
The mean value is used to make a statement about the average execution time. The figure below shows the mean RTT of the previous example.
|
2011-07-26 23:24:22: Marc-Oliver Pahl
2011-07-14 11:31:04: Marc-Oliver Pahl
2011-07-14 11:31:04: Marc-Oliver Pahl - created -
Median
The median xm of N values is given by the index m such that

|
In other words, xm is chosen such that half of the values is larger and the other half smaller than xm. Depending on whether N is odd or even, the index sets of the values smaller and larger are equal or differ by one.
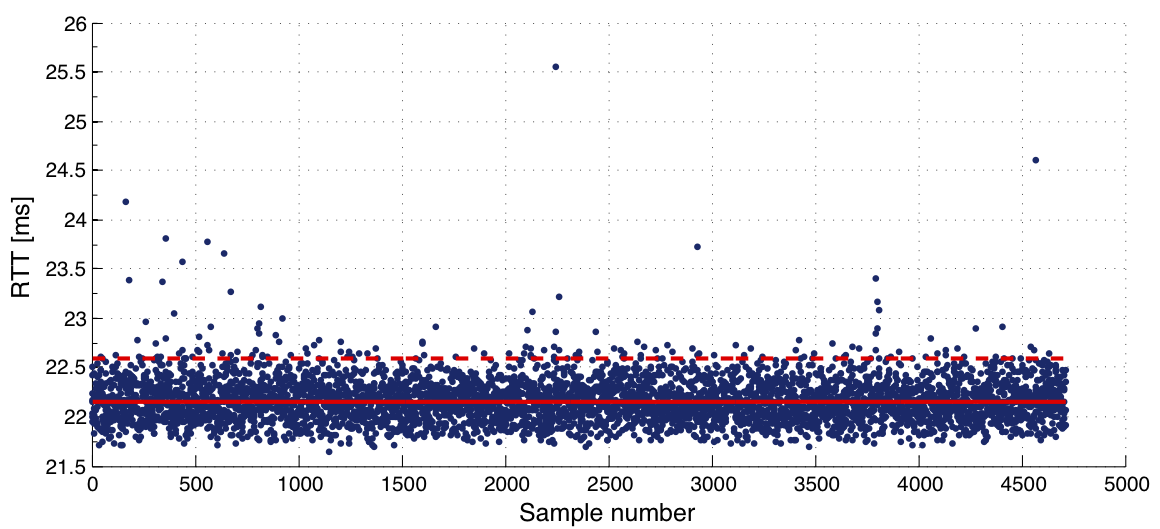
The median value is particularly useful when there a few but severe outliers in your data set. In case of the preceding example, the median and mean values would be roughly the same. However, when we assume a single outlier of 2000ms (which is not unusual for RTT measurements), the mean value increases significantly while the median remains stable. The figure below shows this situation. The dashed line denotes the mean value while the solid line indicates the median.
|
2011-07-26 23:24:22: Marc-Oliver Pahl
2011-07-14 11:31:04: Marc-Oliver Pahl
2011-07-14 11:31:04: Marc-Oliver Pahl - created -
Quantiles
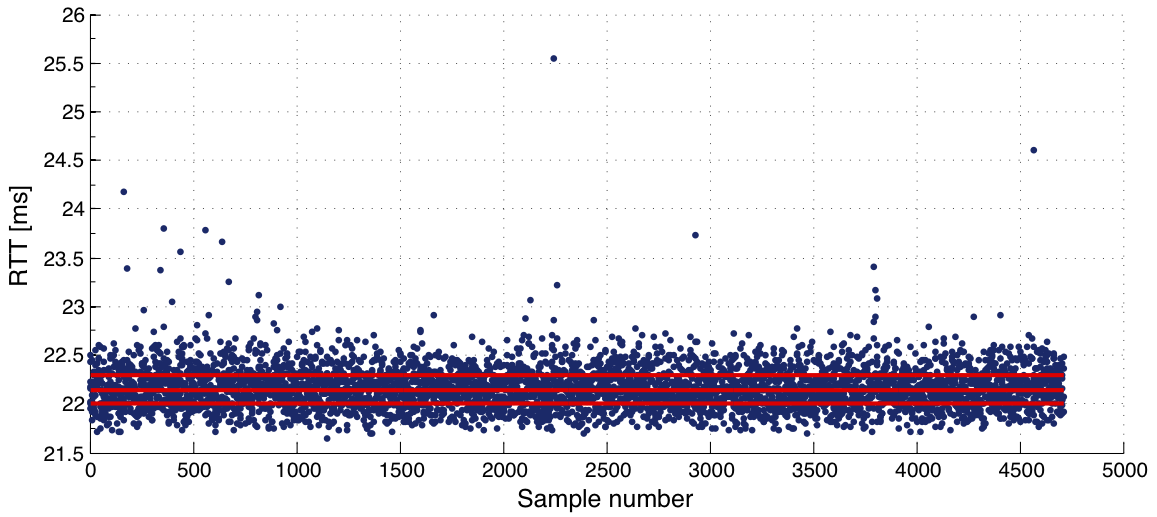
You already know one special quantile: the 0.5-quantile which is nothing else than the median. A parameter α indicates how many values are smaller than the α-quantile xmα.
The figure below shows the 0.25-quantile, 0.5-quantile (median), and 0.75-quantile respectively.
|
2011-07-26 23:24:22: Marc-Oliver Pahl
2011-07-14 11:31:04: Marc-Oliver Pahl
2011-07-14 11:31:04: Marc-Oliver Pahl - created -
2013-12-08 14:17:20: Marc-Oliver Pahl
2013-12-08 14:17:03: Marc-Oliver Pahl
2013-12-08 14:14:18: Marc-Oliver Pahl - created -
2013-12-08 14:23:53: Marc-Oliver Pahl
2013-12-08 14:18:45: Marc-Oliver Pahl - created -
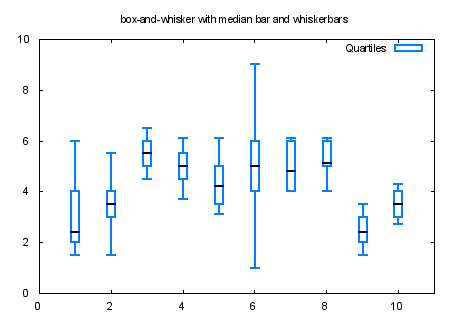
In the practical part of this lab you will create such candlestick plots to compare the performance of DS2OS. We provide you with a GNUPlot script which creates these plots.
Candlestick plots are suitable to graphically represent parameters like minimum/maximum values, median, and quantiles at once. The figure below shows an example for a candlestick plot.
|
The plot shows data for ten different data sets. The minimum and maximum values are represented by the lower and upper horizontal bars. The 0.25-quantiles correspond to the lower ends of the vertical rectangles while the 0.75-quantiles correspond to the upper ends. The horizontal black bars within the rectangles denote the median values.
2013-07-08 13:23:28: Marc-Oliver Pahl
2011-08-19 16:35:52: Marc-Oliver Pahl
2011-07-26 23:24:22: Marc-Oliver Pahl
2011-07-14 11:31:04: Marc-Oliver Pahl
...
10.3. GNUplot
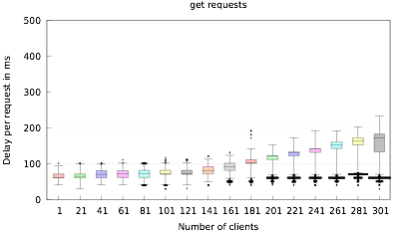
A GNUplot of a measurement result about the latency of DS2OS depending on the amount of clients sending 100 requests in parallel to a single service (this is a worst case scenario).
In this lab we will use GNUplot to draw our graphs. There are lots of tutorials in the web. Have a look at one of them such as the one you can find here
2013-12-08 14:06:17: Marc-Oliver Pahl
2013-12-08 14:04:48: Marc-Oliver Pahl - created -
11. You need a camera in this exercise

In this exercise you will asked to take a photo of your setup several times. Please bring your mobile phone with camera or a camera. In case you do not have a camera we can lend you one.
To upload your image simply use the WIFI and you phone.
2013-06-27 01:03:37: Marc-Oliver Pahl
2013-06-27 01:03:19: Marc-Oliver Pahl
2013-06-27 01:02:45: Marc-Oliver Pahl
2013-06-27 01:02:08: Marc-Oliver Pahl
...
12. List of References
[2] M. Weiser, “The Computer for the 21st Century,” Scientific American, Sep. 1991.
[5] I. T. U. ITU, “ICT Facts and Figures,” ICT Data and Statistics Division Telecommunication Development Bureau International Telecommunication Union Place des Nations 1211 Geneva 20 - Switzerland, Geneva, Feb. 2013.
[6] F. Liu, J. Tong, J. Mao, R. Bohn, J. Messina, L. Badger, and D. Leaf, “NIST Cloud Computing Reference Architecture,” NIST Special Publication, 2011.
2013-12-07 22:12:48: Marc-Oliver Pahl
2013-12-07 22:12:36: Marc-Oliver Pahl
2013-12-07 22:11:25: Marc-Oliver Pahl
2013-12-07 19:21:54: Marc-Oliver Pahl
...
You find this page at the end of every preLab and lab. It is shared between all team members and between preLab and lab. So all of you see the same files and information.
Sometimes you might want to save some text snippets or files to have them available when you restart with the lab or on another computer.
This section is exactly intended for this. You can temporarily store your configurations, commande, etc. here.
2011-10-17 15:50:30: Marc-Oliver Pahl
2011-10-17 15:50:11: Marc-Oliver Pahl
2011-10-17 14:46:25: Marc-Oliver Pahl
2011-10-17 14:46:07: Marc-Oliver Pahl
...
 List of uploaded files
2011-10-17 14:47:38: Marc-Oliver Pahl
2011-10-17 14:43:55: Marc-Oliver Pahl - created -
What did you (dis-)like most about this lab? Do you have suggestions on what could be improved? Did you find any errors? If you have any suggestions or comments about the prelab or lab please let us know! This question has no bearing on your prelab completion.
2011-07-26 23:05:27: Marc-Oliver Pahl
2011-05-19 22:05:05: Marc-Oliver Pahl
2011-05-10 00:33:32: Marc-Oliver Pahl
2007-11-06 18:51:17: Marc-Oliver Pahl
...
2011-10-17 14:40:33: Marc-Oliver Pahl
2011-08-05 18:11:10: Anatol Dammer
2011-08-05 18:10:58: Anatol Dammer
2011-08-05 18:10:46: Anatol Dammer
...
- GW insert notification handler for all LEDs already but do NOT provide the functionality itself. let the students develop it.
- Arduino: parser - length in command as it is very error prone
- describe the subscription feature better. Subscribe each node and not all nodes.
Necessary Software
- dhcpd
- nmap
- Eclipse IDE
- Arduino IDE (will be downloaded and runs in home)
- 10.1.2.0/29 must be reachable over the management interface between PC4 and PC5
2013-06-19 17:49:56: Marc-Oliver Pahl
2013-06-13 13:55:01: Marc-Oliver Pahl
2013-06-13 13:53:02: Marc-Oliver Pahl
2013-06-13 13:52:42: Marc-Oliver Pahl - created -
...
Looks long...
This lab looks very long from the overview. The reason is that we structured it in many small pieces.
We will give you lots of hints and examples in this lab. So just follow the instructions and you should be quickly guided through all steps.
Enjoy the lab - you will learn a lot :)
2013-07-07 13:35:19: Marc-Oliver Pahl
2013-07-07 13:31:49: Marc-Oliver Pahl - created -
Outline of the DS2OS lab
In the practical part of this exercise we will first see the whole DS2OS system working by looking at a web-based interface service and manipulating some context. Then we will build our own Smart Device based on the Arduino platform. Then we will design and implement your own firmware for the device with a communication protocol enabling remote control of the device over network. Next we will design and implement a Gateway to connect our Smart Device with the DS2OS VSL middleware by providing an abstract interface following the conventions of DS2OS. Having the device connected to the abstraction we will experience how easy it is to implement our own orchestration logic in an Orchestration Service. Finally we will assess our solution with three performance measurements from different points of view.
2013-12-12 22:08:58: Marc-Oliver Pahl
2013-12-12 22:08:26: Marc-Oliver Pahl
2013-12-12 22:06:48: Marc-Oliver Pahl
2013-06-11 23:02:30: Marc-Oliver Pahl
...
2013-06-19 15:11:11: Marc-Oliver Pahl
2013-06-19 15:10:45: Marc-Oliver Pahl
2013-06-19 15:10:04: Marc-Oliver Pahl
2013-06-19 15:09:40: Marc-Oliver Pahl
...
Setup
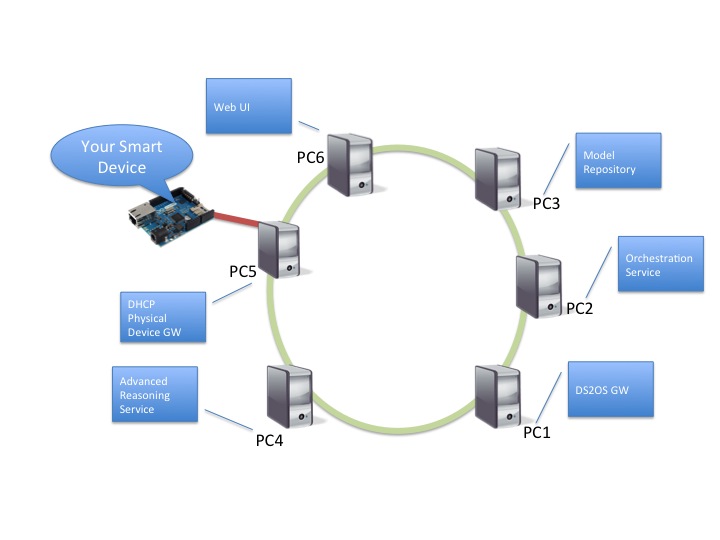
2013-06-27 00:49:29: Marc-Oliver Pahl
2013-06-11 10:51:09: Marc-Oliver Pahl
2013-06-06 13:09:12: Marc-Oliver Pahl
2013-06-06 13:07:21: Marc-Oliver Pahl
...
Roles of the different computers
- PC6 will run the web-based User Interface to your Smart Space. Using the basic data types of DS2OS it can provide access to all context nodes that are available in your space.
- PC5 will provide the physical connectivity to your Smart Device. It will assign an IP to the Arduino via DHCP. It will route the Arduino network traffic to PC4 and vice-versa.
- PC4 will host the Advanced Reasoning Service that helps modularizing functionality.
- PC3 will act as Model Repository. So it will store your abstract interface descriptions (Models).
- PC2 will host the Orchestration Service that runs your orchestration logic.
- PC1 will act as DS2OS Gateway. The role of the gateway is to connect your Smart Device with the DS2OS middleware to make it accessible from other services.
Later on each machine but PC5 a Knowledge Agent will be started to create the distributed VSL middleware.
For connectivity between the Knowledge Agents on the different machines we will use the management network so you do not have to cable the ring shown in the setup above.
2013-12-08 16:19:03: Marc-Oliver Pahl
2013-07-02 14:36:16: Marc-Oliver Pahl
2013-06-19 15:11:58: Marc-Oliver Pahl
2013-06-19 15:06:53: Marc-Oliver Pahl
...
2013-12-03 14:16:06: Marc-Oliver Pahl
2013-07-30 13:10:37: Marc-Oliver Pahl
2013-06-19 15:14:25: Marc-Oliver Pahl
2013-06-19 15:14:09: Marc-Oliver Pahl
...
2013-06-19 15:11:11: Marc-Oliver Pahl
2013-06-19 15:10:45: Marc-Oliver Pahl
2013-06-19 15:10:04: Marc-Oliver Pahl
2013-06-19 15:09:40: Marc-Oliver Pahl
...
2.1. Playing around with the system
We start the lab by playing around with the system a little bit. Later on we will have a closer look at the mechanisms that are used to do the first steps we do now.
In this part we will:
- Set up the VSL peer-to-peer context network.
- Create context nodes in the VSL.
- Set up a web-based user interface to the VSL.
- Manipulate the context nodes using the interface.
2013-12-08 17:10:51: Marc-Oliver Pahl
2013-12-08 16:27:39: Marc-Oliver Pahl
2013-12-08 16:23:10: Marc-Oliver Pahl
2013-12-08 16:21:58: Marc-Oliver Pahl - created -
...
As you know from the prelab, the Virtual State Layer (VSL) is the context-aware µ-middleware core of DS2OS. It makes the information exchange transparent for services.
We will set up a VSL with two nodes now. Use PC3 and PC6.
2013-12-08 17:14:35: Marc-Oliver Pahl
2013-12-08 17:12:47: Marc-Oliver Pahl - created -
Preparing the Downloads
DS2OS is written in Java. We will download the jar archives to PC3 and PC6:
If you want to use wget for downloading make sure you are able to reach the
Internet by setting up the default GW on the PCs. You can use the following command to do
so:
ip r a default via $(dig +short ilab-server)
Make sure that the right GW is set by issuing route.
What does the command do and how does it work?
2013-12-08 17:18:58: Marc-Oliver Pahl
2013-12-08 17:18:24: Marc-Oliver Pahl
2013-12-08 17:17:22: Marc-Oliver Pahl
2013-12-08 17:16:04: Marc-Oliver Pahl
...
Deploying DS2OS
Now download the following archives to the two PCs:
Extract the models.tar.gz into a ~/ds2os/ directory. Move the ds2os.jar into
~/ds2os/.
Create a configuration file for the agent as follows and save it
~/ds2os/config.txt:
network.interface=eth-man
transport.stream.port=6666
transport.datagram.port=6666
transport.compress=false
local.agentid=[myAgentId] ; <-- put your desired AgentID here, e.g. agent4
Make sure to use different agent IDs.
Start the agents on both PCs by issuing
java -jar ds2os.jar --console
Now issue a netstat -tulpen.
Make sure that you do not mix up the DS2OS console and the local shell. OS commands cannot be executed in the DS2OS console...
2013-12-08 17:31:48: Marc-Oliver Pahl
2013-12-08 17:28:48: Marc-Oliver Pahl
2013-12-08 17:28:06: Marc-Oliver Pahl
2013-12-08 17:26:30: Marc-Oliver Pahl
...
2013-12-08 17:37:16: Marc-Oliver Pahl
2013-12-08 17:36:49: Marc-Oliver Pahl
2013-12-08 17:33:21: Marc-Oliver Pahl
2013-12-08 17:31:17: Marc-Oliver Pahl
...
This exercise part is symmetric. That means you can both play with your agent on your screen and you will see symmetric results. Nobody has to watch only...
Go to the agent console and issue ls agentRegister on both PCs. On both
PCs you should see something like:
system@agent6: / % ls agentRegisterNow add a "/*" at the end of the command and issue it again.
<agentRegister type="/system/clientRegister" version="0" timeStamp="2013-12-08 17:35:24.652" subscriber="">
.<agent3 type="/system/clientMetaData" version="0" timeStamp="2013-12-08 17:40:28.002" subscriber="">
.</agent3>
.<agent6 type="/system/clientMetaData" version="0" timeStamp="2013-12-08 17:35:24.666" subscriber="">
.</agent6>
</agentRegister>
2013-12-08 17:49:38: Marc-Oliver Pahl
2013-12-08 17:49:23: Marc-Oliver Pahl
2013-12-08 17:49:08: Marc-Oliver Pahl
2013-12-08 17:48:49: Marc-Oliver Pahl
...
2013-12-03 15:13:55: Marc-Oliver Pahl
2013-12-03 15:07:00: Marc-Oliver Pahl
2013-12-03 15:06:33: Marc-Oliver Pahl
2013-12-03 15:04:46: Marc-Oliver Pahl - created -
Adding Context Nodes
Start wireshark listening to the interface you use on both PCs.
Now change into the context subtree of your agent by issuing
cd [tab] [return]
The agent console should prompt as follows on PC6 now (on PC3 the 6s are replaced by 3s):
system@agent6: /agent6 %
Now add some nodes of type /basic/text on both PCs by issuing:
system@agent6: /agent6 % add fooBar /basic/text
Replace fooBar with the desired names of your new nodes.
Test that the nodes are there by using get [address].
Now assign some values to some nodes, e.g.
system@agent6: /agent6 % set fooBar "Hello world!"
get the node again and look at the data.
Now get only the value:
system@agent6: /agent6 % get fooBar/value
Make sure you added multiple nodes on both PCs.
2013-12-08 17:59:06: Marc-Oliver Pahl
2013-12-08 17:57:48: Marc-Oliver Pahl
2013-12-08 17:56:12: Marc-Oliver Pahl
2013-12-08 17:54:34: Marc-Oliver Pahl
...
Synchronization
Now change into the root directory of your agent and list the knowledge tree of the other agent by issuing:
system@agent6: / % ls agent3
Get the value of a node from the other agent.
Now have a look at your wireshark capture. Use follow TCP stream to have a look at the exchanged data.
If you do not see TCP streams, restart one of the agents to enforce synchronization.
2013-12-09 13:19:28: Marc-Oliver Pahl
2013-12-08 18:19:37: Marc-Oliver Pahl
2013-12-08 18:16:28: Marc-Oliver Pahl
2013-12-08 18:07:18: Marc-Oliver Pahl
...
2013-12-08 18:20:52: Marc-Oliver Pahl
2013-12-08 18:20:19: Marc-Oliver Pahl - created -
What is the purpose of the hash value in the message? You can also find it in the agentRegister subtree of an agent in your local KOR:
system@agentId: /agentRegister % get agentId/korVersionId

<korVersionId type="/basic/text" version="3" timeStamp="2013-12-13 19:03:02.605" subscriber="">
<![CDATA[16]]>
</korVersionId>
To answer the next question properly it might be interesting to start a new agent and to look how it synchronizes with the existing knowledge... in the console, and in wireshark.
2013-12-13 19:05:22: Marc-Oliver Pahl
2013-12-13 19:04:35: Marc-Oliver Pahl
2013-12-13 19:01:24: Marc-Oliver Pahl
2013-12-13 19:01:16: Marc-Oliver Pahl
...
... 19:54:07 Marc-Oliver Pahl
2013-12-13 19:06:16: Marc-Oliver Pahl
2013-12-13 14:20:53: Marc-Oliver Pahl
2013-12-08 18:32:00: Marc-Oliver Pahl
...
Compare the outputs of lsL [localAgentId]/* and lsL
[remoteAgentId]/*.
Adding an "L" to the command tells the console to interact with the local context repository, the Knowledge Object Register (KOR), only. Requests without trailing L are sent to the normal processing queue, resulting in remotely executed queries.
2013-12-13 18:58:53: Marc-Oliver Pahl
2013-12-13 18:32:44: Marc-Oliver Pahl
2013-12-08 18:37:43: Marc-Oliver Pahl
2013-12-08 18:36:51: Marc-Oliver Pahl - created -
... 19:54:30 Marc-Oliver Pahl
2013-12-13 18:31:27: Marc-Oliver Pahl
2013-12-08 18:39:54: Marc-Oliver Pahl
2013-12-08 18:38:48: Marc-Oliver Pahl - created -
... 19:54:50 Marc-Oliver Pahl
2013-12-08 18:41:23: Marc-Oliver Pahl
2013-12-08 18:40:02: Marc-Oliver Pahl - created -
Creating Composed Nodes with Geolocations
The interface we will set up next is based on a spatial representation of context nodes. Therefore add at least one composed node with a geolocation to on each PC as follows:
system@agent6: /agent6 % add myGeoText /basic/composed
system@agent6: /agent6 % add myGeoText/text /basic/text
system@agent6: /agent6 % add myGeoText/running /basic/composed
system@agent6: /agent6 % add myGeoText/running/geolocation /demo/geolocation
2013-12-09 14:50:55: Marc-Oliver Pahl
2013-12-09 14:31:13: Marc-Oliver Pahl
2013-12-09 14:31:01: Marc-Oliver Pahl
2013-12-09 14:23:53: Marc-Oliver Pahl
...
Listing the geolocation node
Now list your modified node:
system@agent3: /agent3 % ls myGeoText/*

<myGeoText type="/basic/composed" version="0" timeStamp="2013-12-09 14:51:14.79" subscriber="">
.<running type="/basic/composed" version="0" timeStamp="2013-12-09 14:51:14.81" subscriber="">
..<geolocation type="/demo/geolocation" version="0" timeStamp="2013-12-09 14:51:15.808" subscriber="">
...<alt type="/derived/decimal" version="0" timeStamp="2013-12-09 14:51:15.844" subscriber="">
....<post-decimal type="/basic/number" version="0" timeStamp="2013-12-09 14:51:15.85" subscriber="">
....</post-decimal>
....<pre-decimal type="/basic/number" version="0" timeStamp="2013-12-09 14:51:15.847" subscriber="">
....</pre-decimal>
...</alt>
...<lat type="/derived/decimal" version="0" timeStamp="2013-12-09 14:51:15.814" subscriber="">
....<post-decimal type="/basic/number" version="0" timeStamp="2013-12-09 14:51:15.823" subscriber="">
....</post-decimal>
....<pre-decimal type="/basic/number" version="0" timeStamp="2013-12-09 14:51:15.818" subscriber="">
....</pre-decimal>
...</lat>
...<lon type="/derived/decimal" version="0" timeStamp="2013-12-09 14:51:15.829" subscriber="">
....<post-decimal type="/basic/number" version="0" timeStamp="2013-12-09 14:51:15.841" subscriber="">
....</post-decimal>
....<pre-decimal type="/basic/number" version="0" timeStamp="2013-12-09 14:51:15.835" subscriber="">
....</pre-decimal>
...</lon>
..</geolocation>
.</running>
.<text type="/basic/text" version="0" timeStamp="2013-12-09 14:51:14.801" subscriber="">
.</text>
</myGeoText>
The result shows you how the VSL automatically loaded the inherited type's definitions, e.g. /demo/geolocation is defined as:
grml@pc6 ~/ds2os/models/basic % cat ../demo/geolocation.xml
<model>
      <lat type="/derived/decimal"></lat>
  <lon type="/derived/decimal"></lon>
  <alt type="/derived/decimal"></alt>
</model>
At the multiple types you can also see the multi-inheritance.
2013-12-08 18:55:34: Marc-Oliver Pahl
2013-12-08 18:54:53: Marc-Oliver Pahl
2013-12-08 18:51:37: Marc-Oliver Pahl
2013-12-08 18:42:10: Marc-Oliver Pahl - created -
...
Type-based Search
Finally use the search command to look for nodes of type
/demo/geolocation. Your result should include all nodes that you edited:
system@agent6: /agent6/fooBar % search /demo/geolocation
Result for type /demo/geolocation in address /
1       /agent3/myGeoText/running/geolocation
2       /agent6/myGeoText/running/geolocation
2013-12-08 18:59:41: Marc-Oliver Pahl
2013-12-08 18:58:37: Marc-Oliver Pahl - created -
Now we have at least four nodes in the VSL, and two of them have a
/running/geolocation node.
After this preparation we can set up the interface on PC6 now.
2013-12-08 19:06:23: Marc-Oliver Pahl
2013-12-08 19:05:07: Marc-Oliver Pahl - created -
REST connector
The web interface wants to communicate with the VSL over a REST interface. Therefore we start a REST DS2OS servlet connector on PC6
For being able to connenct to the VSL, make sure the Knowledge Agent is still running on PC6.
The soon the servlet is called for the first time, it connects with this agent and keeps the association. If you restart/ redeploy the agent, do not forget to restart the servlet. You can restart the servlet by issueing:
service tomcat7 restart
2013-12-08 19:17:13: Marc-Oliver Pahl
2013-12-06 14:33:45: Marc-Oliver Pahl
2013-12-06 14:33:32: Marc-Oliver Pahl
2013-12-06 14:31:06: Marc-Oliver Pahl
...
Installation Required Linux Packets
The REST API is implemented as Java servlet. It will be run inside a Tomcat.
In this lab we need the web server apache, the Java servlet runtime engine tomcat, and the mod-jk that connects the apache with the tomcat.
If some of the required software is missing, you can install it by issuing:
apt-get install apache2 tomcat7 libapache2-mod-jk
Do not forget to add the default gateway first as described here.
2013-12-08 19:18:29: Marc-Oliver Pahl
2013-12-06 14:31:36: Marc-Oliver Pahl
2013-12-06 13:56:58: Marc-Oliver Pahl
2013-12-06 13:50:42: Marc-Oliver Pahl
...
setting mod-jk up
Now configure apache to forward requests to the /ds2os sub directory to the tomcat. As we will only host one web site we will use the default configuration for this lab.
Add the following line to the default webserver configuration of apache2 (e.g. 000-default) inside the VirtualHost container:
JkMount /ds2os* ajp13_worker
In the tomcat configuration (e.g. /etc/tomcat7/server.xml) enable AJP by
uncommenting the line:
    <!-- Define an AJP 1.3 Connector on port 8009 -->
    <Connector port="8009" protocol="AJP/1.3" redirectPort="8443" />
Restart tomcat and reload the apache config by issuing:
service tomcat7 restart
service apache2 reload
Now use a browser that is able to access the localhost without the proxy apache (e.g. firefox) and access http://localhost/ds2os. You should not get an apache error page if tomcat and apache are connected correctly.
2013-12-09 13:23:27: Marc-Oliver Pahl
2013-12-08 19:36:54: Marc-Oliver Pahl
2013-12-08 19:35:47: Marc-Oliver Pahl
2013-12-08 19:35:14: Marc-Oliver Pahl
...
Installing the DS2OS Servlet Connector
Download the DS2OS servlet from here. Move it into the tomcat webapps directory (e.g. /var/lib/tomcat7/webapps).
Configure the servlet by editing its config
(/var/lib/tomcat7/webapps/ds2os/WEB-INF/lib/config.txt) so that it reflects
your setup, e.g.
transport.datagram.port=6666
transport.stream.port=6666
transport.compress=false
If the config is missing, access the servlet first, so that it gets unpacked.
You can also create a symlink to ~/ds2os/config.txt but do not forget to reset this link later again if it is not working anymore as we will delete and recreate the ds2os directory later which will destroy the symlink.
You can test the functionality of the servlet connector by calling its REST interface at http://localhost/ds2os. You should see the help page now.
Query the VSL context directory "/" using the servlet connector.
2013-12-08 19:49:20: Marc-Oliver Pahl
2013-12-08 19:48:12: Marc-Oliver Pahl
2013-12-08 19:43:58: Marc-Oliver Pahl
2013-12-06 14:10:32: Marc-Oliver Pahl
...
2013-12-08 19:39:14: Marc-Oliver Pahl
2013-12-06 14:13:26: Marc-Oliver Pahl
2013-12-06 14:11:46: Marc-Oliver Pahl
2013-12-06 14:11:12: Marc-Oliver Pahl
...
Installing the Web Site
Download the website from here.
Extract the archive into your web servers root directory as specified in the VirtualHost container you edited before.
Now you should be able to access the graphical user interface by calling the local web server, e.g. http://192.168.X.X/
You will most probably not see any nodes.
2013-12-08 19:57:30: Marc-Oliver Pahl
2013-12-06 14:15:31: Marc-Oliver Pahl
2013-12-06 14:14:33: Marc-Oliver Pahl
2013-12-06 14:08:45: Marc-Oliver Pahl
...
Adding Access Rights
You can see the reason when you change the log level in the console to debug by issuing
ll debug
and reloading the interface.
Do not forget to set the log level back to warn (ll warn), not to get
irritated by the log messages.
You will get access rights errors such as
[D] [NodeTree ] Node /clientRegister is not readable by /agent6/servlet-connector
To give the servlet connector access to our nodes we have to set the rights. To do so issue
addReaderR fooBar /agent6/servlet-connector
addWriterR fooBar /agent6/servlet-connector
Add the read and write rights at least to one node that you added a geolocation node to and one where you did not add it.
Now list the gelocation data of the node where you added it
/agent6/servlet-connector@agent6: /agent6 % ls fooBar/running/geolocation/*

<geolocation type="/demo/geolocation" version="0" timeStamp="2013-12-08 20:14:31.472" subscriber="">
.<alt type="/derived/decimal" version="0" timeStamp="2013-12-08 20:14:31.512" subscriber="">
..<post-decimal type="/basic/number" version="0" timeStamp="2013-12-08 20:14:31.521" subscriber="">
..</post-decimal>
..<pre-decimal type="/basic/number" version="0" timeStamp="2013-12-08 20:14:31.516" subscriber="">
..</pre-decimal>
.</alt>
.<lat type="/derived/decimal" version="0" timeStamp="2013-12-08 20:14:31.482" subscriber="">
..<post-decimal type="/basic/number" version="0" timeStamp="2013-12-08 20:14:31.493" subscriber="">
..</post-decimal>
..<pre-decimal type="/basic/number" version="0" timeStamp="2013-12-08 20:14:31.488" subscriber="">
..</pre-decimal>
.</lat>
.<lon type="/derived/decimal" version="0" timeStamp="2013-12-08 20:14:31.497" subscriber="">
..<post-decimal type="/basic/number" version="0" timeStamp="2013-12-08 20:14:31.507" subscriber="">
..</post-decimal>
..<pre-decimal type="/basic/number" version="0" timeStamp="2013-12-08 20:14:31.503" subscriber="">
..</pre-decimal>
.</lon>
</geolocation>
Next drag and drop the nodes on the interface.
Have a look at the geolocation node again.
2013-12-09 14:16:37: Marc-Oliver Pahl
2013-12-09 14:15:34: Marc-Oliver Pahl
2013-12-08 20:16:37: Marc-Oliver Pahl
2013-12-08 20:15:43: Marc-Oliver Pahl
...
Graphical Elements
To show you where the interface goes add another node and set the access rights so that the servlet connector can read and write the entire subtree.
User the type
add myVirtualLight /demo/virtuallight
Make your virtual light accessible to the servlet connector.
Now play with the new GUI element and observe the changes in
get myVlight/running/isOn/value
To see how the bidirectional reflection works, change the VSL context and see how the interface changes:
/agent6/servlet-connector@agent6: /agent6 % set myVlight/running/isOn TRUE
/agent6/servlet-connector@agent6: /agent6 % set myVlight/running/isOn FALSE
The interface is only updated in intervals, so wait some seconds until it updates
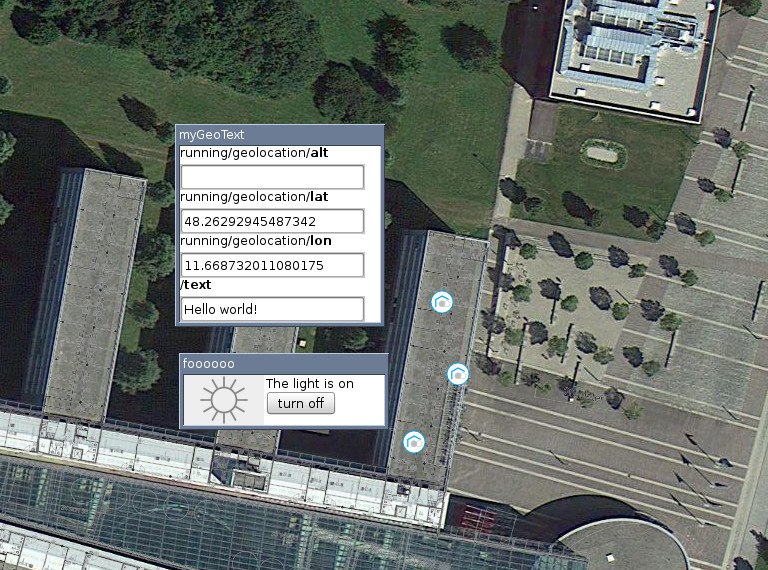
The web user interface with the virtual light and the geo-text node.
2013-12-09 15:34:02: Marc-Oliver Pahl
2013-12-08 20:32:14: Marc-Oliver Pahl
2013-12-08 20:29:35: Marc-Oliver Pahl
2013-12-08 20:29:22: Marc-Oliver Pahl
...
Stop all Services
Now you have some experience in using DS2OS. Next we will start some performance measurements.
- Stop the TomCat
- Stop the Apache
- Quit ("q") the agents
- Close Wireshark
2013-12-08 20:39:06: Marc-Oliver Pahl
2013-12-08 20:36:23: Marc-Oliver Pahl - created -
Do you want to have a break?
The following parts are not connected to what you did so far. So if you want to stop now or have a break, now is a good time.
If you only want to have a break you could continue for some more minutes and do the setup for the performance measurement and start it before having the break.
2013-12-08 21:24:30: Marc-Oliver Pahl
2013-12-08 20:34:17: Marc-Oliver Pahl
2013-12-08 20:33:21: Marc-Oliver Pahl - created -
2013-07-08 13:31:55: Marc-Oliver Pahl
2013-07-08 13:02:58: Marc-Oliver Pahl
2013-07-08 13:01:29: Marc-Oliver Pahl - created -
The measurement will take some time (>45min) that we will use for something else. So if you set it up now, you will have to continue with the lab or to wait until it finishes before going home.
Setup
For the measurement we will start 250 services, one server, and one control service. As it would take time to start all services and to setup all PCs we will do it via shell scripts.
On PC1 set the default gateway so that you can reach the Internet:
ip r a default via $(dig +short ilab-server)
Make sure that the right GW is set by issuing route.
2013-12-03 17:23:43: Marc-Oliver Pahl
2013-12-03 17:23:29: Marc-Oliver Pahl
2013-12-03 14:25:11: Marc-Oliver Pahl
2013-12-03 14:25:07: Marc-Oliver Pahl
...
Now download the following deployment script deployDS2OS.tar.gz with wget to any PC you like and expand it.
Now call the following script with root rights:
./deployAll.sh
The script deploys DS2OS including some services. The partner script is called killAll.sh and as the name says, it kills all processes belonging to DS2OS.
Have a quick look at what both scripts are roughly doing.
Now issue with root rights:
screen -r
It shows you a list of screens you can attach to on each PC.
2013-12-03 17:50:20: Marc-Oliver Pahl
2013-12-03 17:49:38: Marc-Oliver Pahl
2013-12-03 17:27:55: Marc-Oliver Pahl
2013-12-03 17:24:45: Marc-Oliver Pahl
...
After running the script what is running on each host? Please continue the list:
PC1: a KnowledgeAgent, MeasureControl, and a MeasureServer are running.
... 09:43:18 Timm Böttger
... 20:24:09 Marc-Oliver Pahl
... 19:56:08 Marc-Oliver Pahl
2013-12-08 20:41:53: Marc-Oliver Pahl
...
Now we connect to the VSL by issuing:
screen -r ds2os
- [Ctrl+a] enables the command mode. The next letter typed is the command you execute. [ESC] aborts.
- [Ctrl+a] [d] detaches from the current screen.
- [Ctrl+a] [ enters the scroll mode. You can leave it again by pressing [ESC].
Get familiar with the VSL console shell. Start by issuing "help" or simply pressing return to get the help displayed.
Now list the agentRegister that contains the neighboring Knowledge Agents:
ls agentRegister
2013-12-03 17:51:38: Marc-Oliver Pahl
2013-12-03 15:02:55: Marc-Oliver Pahl
2013-12-03 15:02:43: Marc-Oliver Pahl
2013-12-03 15:02:21: Marc-Oliver Pahl
...
Services
Now we will have a look at the services and their directories.
List the subtree of PC4.
What could you do with the search command?
2013-12-08 20:58:01: Marc-Oliver Pahl
2013-12-08 20:57:49: Marc-Oliver Pahl
2013-12-08 20:57:34: Marc-Oliver Pahl
2013-12-03 15:14:45: Marc-Oliver Pahl
...
2013-12-08 20:58:25: Marc-Oliver Pahl
2013-12-08 20:57:54: Marc-Oliver Pahl - created -
Measurement Control Service
For the measurement services with different purpose are running now:
- A measurementServer that serves the client requests and is used as measurement target.
- A measurementControl service (mcs) that controls the measurement by configuring the clients and triggering different scenarios.
- Multiple clientServices (mCl) that act as client in the measurement.
- A ModelRepository that serves the VSL context models (Model) of the running services.
Remember that the VSL provides location transparency.
2013-12-03 15:23:10: Marc-Oliver Pahl
2013-12-03 15:22:08: Marc-Oliver Pahl
2013-12-03 15:21:04: Marc-Oliver Pahl
2013-12-03 15:17:55: Marc-Oliver Pahl - created -
...
2013-12-03 16:33:02: Marc-Oliver Pahl
2013-12-03 15:39:32: Marc-Oliver Pahl
2013-12-03 15:24:01: Marc-Oliver Pahl - created -
Change into the knowledge tree of the measurement control service (mcs). In case you are interested you can find its source code here: MeasurementControlService.java.
When you look at the nodes of the control service, you will see that they are virtual. As accessing nodes is always transparent in the VSL you can read values from Virtual Nodes with the regular get. To set Virtual Nodes you can use the normal set.
You can set different values there:
- amIparticipating wit added "/clientId" returns a 1 if the clientId is participating in the current measurement.
- fullRunStartAmount is the amount of clients the measurement starts with.
- fullRunStepping is the stepping the current client amount is decreased each round.
- fullRunTrigger triggers a measurment.
- minimumLogsToCollectPerTest contains the amount of client logs that must at least be collected before the next test s triggered.
- remainingClientIds contains a list of IDs that did not return yet from the last measurement.
- singleRunTrigger starts a single test.
- testModes contains all available test modes.
- testMode contains the index of the mode to be used for the next test run.
- testRunsClient contains the runs each client should do in a test run.
- timeOfNextRun contains the unix timestamp when the next measurement will start.
- waitUntilNextStart contains the seconds to wait per client until until the measurement starts. The overall waiting time is calculated as #participatingClients * waitUntilNextStart
Before triggering the measurement do the following setup:
- Set the start amount to 126.
- Set the stepping to 25.
- Set the minimumLogsToCollectPerTest to 50
Now trigger the measurement by issueing:
set fullRunTrigger 1
Now detach from the screen by pressing [Ctrl a] [d] (First [Ctrl+a] and then [d]).
To see what the measurement control is doing attach to its screen with screen -r measurmentControl on PC1.
In a screen session you can enter the scroll mode with [Ctrl+a] [. You can exit the scroll mode by pressing [ESC].
2013-12-13 19:27:35: Marc-Oliver Pahl
2013-12-08 21:07:44: Marc-Oliver Pahl
2013-12-08 21:02:35: Marc-Oliver Pahl
2013-12-03 19:07:04: Marc-Oliver Pahl
...
2013-12-08 21:09:19: Marc-Oliver Pahl
2013-12-03 16:12:17: Marc-Oliver Pahl
2013-12-03 16:08:07: Marc-Oliver Pahl - created -
Measurement Monitoring
During the measurement you can monitor the actions in the screen of the measurement control
service (measureControl). If you are interested in the CPU usage, you can
monitor it with htop in parallel as shown in the figure.
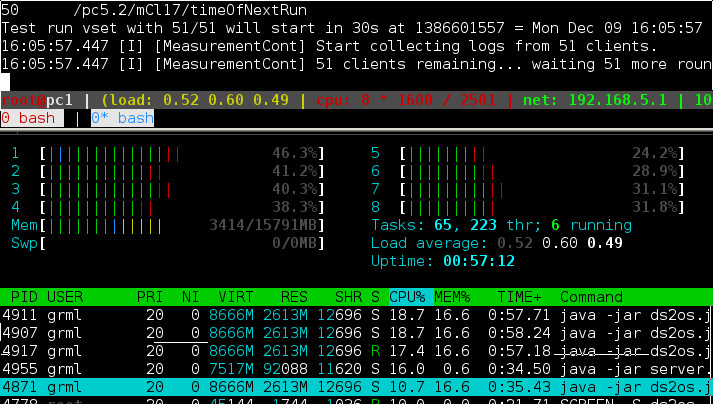
The console output of the measurement console and htop during an active measurement session with 2600 parallel requests towards the measurement server service, running on the machine.
The measurement will take some time that we will use for something else. Make sure that the measurement service is still active and doing work from time to time (e.g. by keeping its console open). We will come back to the collected logs later. The last run will be with 1 client and it will be repeated 50 times according to our setup.
If you find out that one agent is apparently not reachable in the ping part of the control
service, you can simply restart it by copying the deployMe.sh script to it and
executing it. It will shut down everything on the local machine and restart it. (Do not do
this on PC1 as it will delete all collected logs.)
The result to this measurement will be collected later. If you want to leave before reaching the part "Collecting the Logs of the First Performance Measurement", consider Collecting the Logs of the First Performance Measurement anyways before leaving if this measurement finished already.
2013-12-19 13:26:01: Marc-Oliver Pahl
2013-12-14 14:56:41: Marc-Oliver Pahl
2013-12-10 10:29:48: Marc-Oliver Pahl
2013-12-08 21:22:52: Marc-Oliver Pahl
...
2013-07-08 13:31:55: Marc-Oliver Pahl
2013-07-08 13:02:58: Marc-Oliver Pahl
2013-07-08 13:01:29: Marc-Oliver Pahl - created -
What we will do in this part...
In this part we will build and test our own Smart Device. As base we use the Arduino platform. We will first add one item of each component we have available. Then you can add more sensors and actuators if you want.
To make sure you connect the sensors and actuators correctly we provided you with their setups in the PreLab already.
2013-12-08 21:29:23: Marc-Oliver Pahl
2013-07-02 22:11:59: Marc-Oliver Pahl
2013-06-19 16:41:46: Marc-Oliver Pahl
2013-06-19 15:22:48: Marc-Oliver Pahl
...
2013-06-19 15:11:11: Marc-Oliver Pahl
2013-06-19 15:10:45: Marc-Oliver Pahl
2013-06-19 15:10:04: Marc-Oliver Pahl
2013-06-19 15:09:40: Marc-Oliver Pahl
...

2013-07-02 22:26:00: Marc-Oliver Pahl
2013-07-02 15:11:45: Marc-Oliver Pahl
2013-07-02 15:09:35: Marc-Oliver Pahl
2013-07-02 15:09:07: Marc-Oliver Pahl
...
4.2.1. Quick description of arduino board
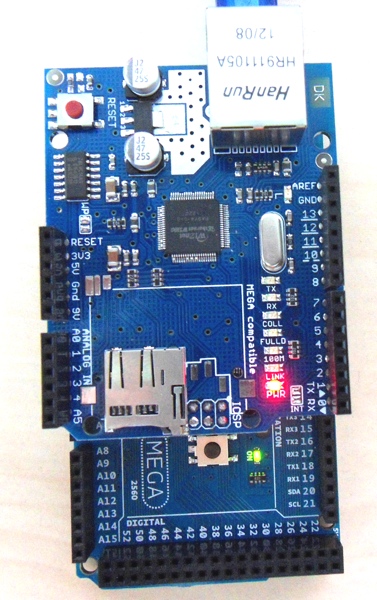
This page gives you a quick start to prototyping with the Arduino platform.
On the right you see a photo of the Arduino that we use in the lab. The analog pins are located on the left side, the digital ones on the right and at the bottom. Power, USB and Ethernet are connected from the top. The red button in the top left corner is a reset button. Pressing it will cause the Arduino to reset and startup the application again. Doing so does not harm the Arduino, neither does removing the power supply or ethernet cable. When connected via USB, an additional power supply is usually not needed.
The digital pins provide 5V (when configured as digital output in a HIGH state) and support up to 40 mA per pin.
The analog pins support a 10bit resolution between 0V and +5V input.
Close to the top left of digital pin 13 is an on-board LED which is connected to pin 13. We will use it a few times as an easy-to-use LED in our demo programs. This LED will also blink rapidly while uploading the compiled code.
When prototyping, the pins on the Arduino are typically connected to a solderless breadboard via flexible jumper wires. This allows quick changes to the setup.
2013-06-20 01:34:24: Johann Dichtl
2013-06-20 01:28:18: Johann Dichtl
2013-06-20 01:26:18: Johann Dichtl
2013-06-20 01:22:26: Johann Dichtl
...
We will build the setup iteratively. So keep all components you connect next on the board. We will use them later again.
2013-07-02 22:26:00: Marc-Oliver Pahl
2013-07-02 15:11:45: Marc-Oliver Pahl
2013-07-02 15:09:35: Marc-Oliver Pahl
2013-07-02 15:09:07: Marc-Oliver Pahl
...
Setting up the LED hardware
The first task is to set up a simple circuit from the power line of the arduino to power a single LED. This will help you to get familiar with the electric components and the Integrated Development Environment (IDE).
The following circuit scheme (Fig. 3) shows the starting layout.
- Start with connecting the beadboard power lines (red and blue) with the arduino +5V and ground
- Remember the layout of the breadboard!
- Add the resistor
- Add the LED and the jumper wire as shown. Keep in mind, that the longer pin of the LED is facing the positive charge. The head also has a flattened side, which has to face the negative charge,
- Check your setup
- When everything is fine, power up the Arduino by connecting it to your PC via the usb cable
Now the LED should light up.
Please use the circuit diagrams (above) for the setup. The picture (below) is only for illustration on how it may look like.
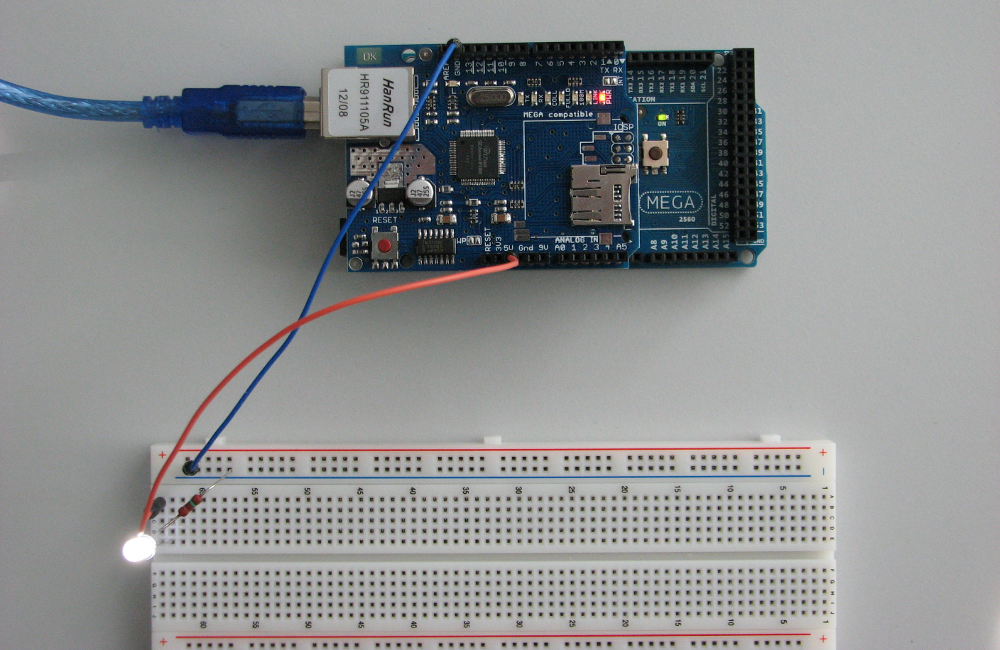
2013-07-02 22:15:24: Marc-Oliver Pahl
2013-07-02 15:30:16: Marc-Oliver Pahl
2013-06-27 00:50:17: Marc-Oliver Pahl
2013-06-20 10:57:06: Timm Böttger
...
The Integrated Development Environment
The Arduino platform brings a comfortable Integrated Development Environment (IDE). We will use it in this lab to program the device.
You read about it in the PreLab already.
- Download the IDE from the Arduino website (local copy of arduino-1.0.5-linux64.tgz).
- Extract it to your home directory.
- Start it.
2013-07-02 22:29:43: Marc-Oliver Pahl
2013-06-12 14:30:58: Marc-Oliver Pahl
2013-06-12 14:28:24: Marc-Oliver Pahl - created -
LED blink demo
The next step is to control the LED with the Arduino. The IDE comes with multiple demo applications that can be used.
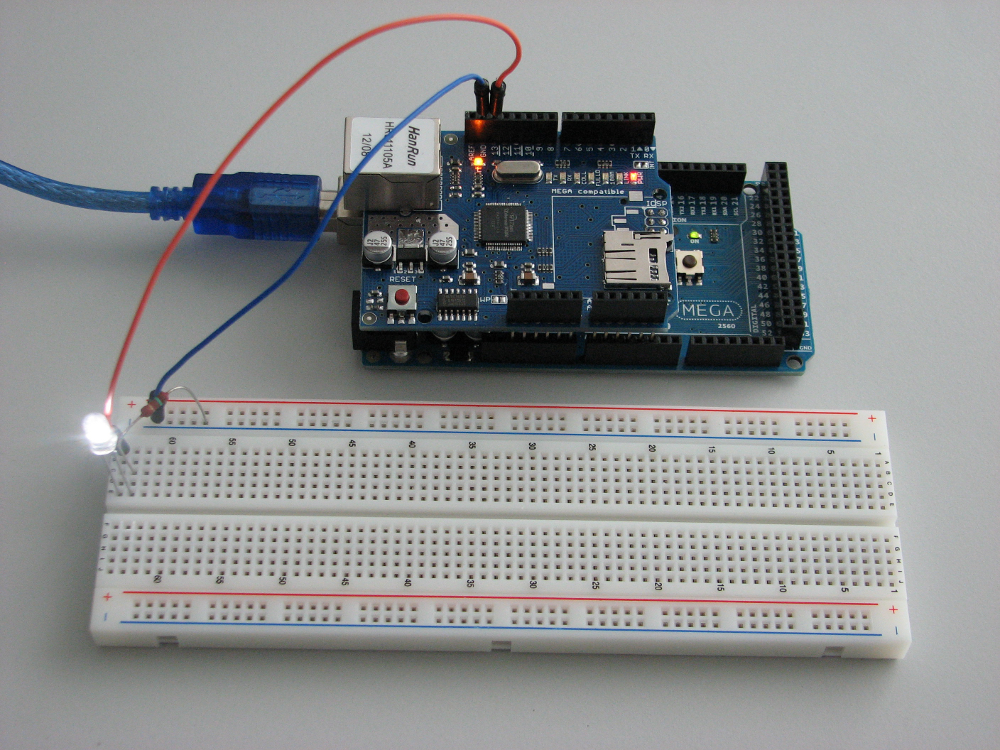
- Configure the IDE for the right Arduino model (Arduino Mega 2560)
- Tools
- Board
- Load the "Blink" demo from the IDE (open --> Basics -> Blink)
- Review the demo sketch. Which physical pin is used in the program?
- Make sure to select the right Serial Port ( Tools > Serial Port > /dev/ttyACM0 )
- Click on the upload button to compile and upload the sketch (it may be necessary to set the right port).
One of the on-board LEDs should blink now. This LED is also connected to the digital pin #13. Take a quick look at the program: it is quite easy to turn digital pins on and off.
Change the breadboard wiring from the first tutorial to have the LED circuit be powered from the digital pin #13, instead of the +5V output.
The digital output pin will also provide +5V when set to "HIGH". When done, both LEDs should blink simultaneously.
Circuit Diagramm
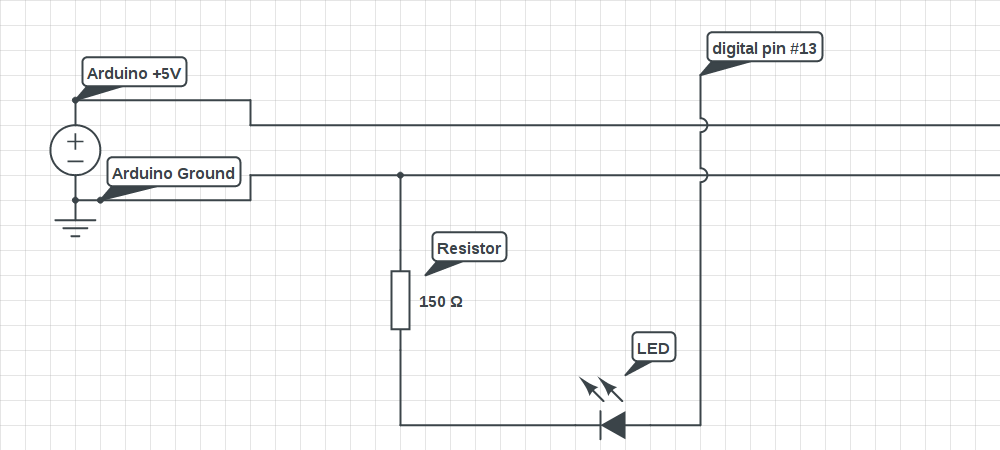
2013-06-20 10:57:48: Timm Böttger
2013-06-19 20:12:00: Johann Dichtl
2013-06-19 16:03:22: Marc-Oliver Pahl
2013-06-19 15:51:06: Marc-Oliver Pahl
...
2013-06-12 14:21:03: Marc-Oliver Pahl
2013-06-12 14:20:10: Marc-Oliver Pahl - created -
2013-07-02 22:26:00: Marc-Oliver Pahl
2013-07-02 15:11:45: Marc-Oliver Pahl
2013-07-02 15:09:35: Marc-Oliver Pahl
2013-07-02 15:09:07: Marc-Oliver Pahl
...
We will build the setup iteratively. So keep all components you connect next on the board. We will use them later again.
2013-07-02 22:26:00: Marc-Oliver Pahl
2013-07-02 15:11:45: Marc-Oliver Pahl
2013-07-02 15:09:35: Marc-Oliver Pahl
2013-07-02 15:09:07: Marc-Oliver Pahl
...
Temperature Resistor Hardware and Driver
The Arduino also provides analog input pins, which will be tested next.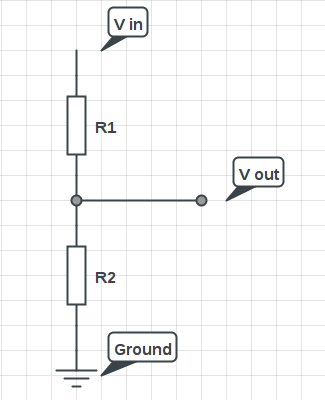
For this we build a small circuit on the breadboard: a "voltage divider", consisting of
- a fixed resistor (R1), and
- a temperature-sensitive resistor (R2)
as shown on the circuit diagram.
A voltage divider takes an input Voltage V_in and separates it to two (or more) output voltages. In our example one of the outputs is connected to the ground. The output voltages depend on the input voltage V_in and on the resistor values. For more information on voltage dividers, see here.
In our case the input Voltage V_in is +5V, R1 is 3240Ω and R2 depends on the current temperature.
We connect V_out with the Arduino analog input A0 and measure V_out.
The higher the temperature is, the higher the resistance at R2 is and as a result the voltage at V_out is also higher. So we can map the measured voltage at V_out with the current temperature.
The temperature sensor in use here is the KTY81 220.
It has a typical resistance of 980Ω at -55°C, 2000Ω at 25°C and 4280Ω at 150°C.
The Voltage divider will make our measurements more sensetive in the 20°C to 30°C range. In this spreadsheet you can see the (expected) voltages (marked [V]) at V_out, and the (expected) value from an analogRead call (marked [A_in]) for different resistors, including the 3240Ω resistor for this exercise.
2013-06-20 10:41:17: Marc-Oliver Pahl
2013-06-19 20:44:08: Johann Dichtl
2013-06-19 20:42:39: Johann Dichtl
2013-06-19 20:41:57: Johann Dichtl
...
2013-12-12 14:36:34: Marc-Oliver Pahl
2013-06-20 01:20:59: Johann Dichtl
2013-06-19 16:14:47: Marc-Oliver Pahl
2013-06-19 16:14:31: Marc-Oliver Pahl
...
Adding the Temperature Sensor to the Breadboard
Extend the circuit on you breadboard to match the circuit diagram shown below. Make sure that you use the right resistor.
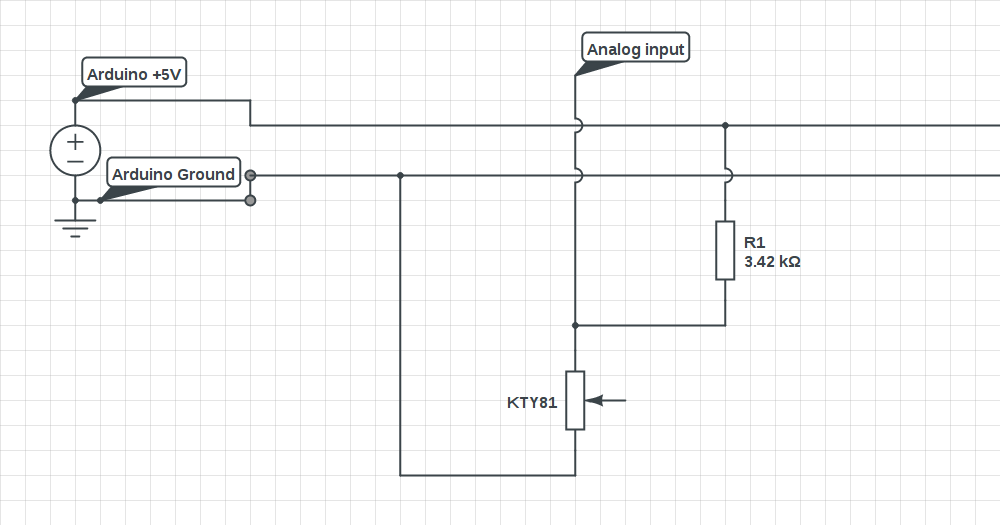
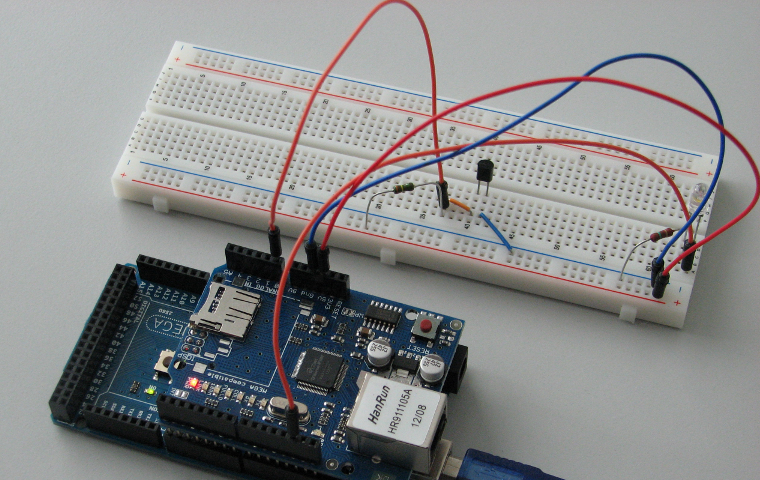
2013-06-19 20:45:44: Johann Dichtl
2013-06-19 16:23:15: Marc-Oliver Pahl
2013-06-19 16:18:04: Marc-Oliver Pahl
2013-06-19 16:12:36: Marc-Oliver Pahl
...
Load the Smoothing Demo
Now load the "Smoothing" Demo (Open -> Analog -> Smoothing). Compile and upload it onto your Arduino. Open the serial console in the IDE. You should see the current value of the analog sensor, a value very roughly around 400. Touch the sensor with your finger and notice how the measured value raises.
2013-07-03 22:07:56: Fabian Oehlmann
2013-06-20 01:38:51: Johann Dichtl
2013-06-19 20:52:27: Johann Dichtl
2013-06-19 16:27:54: Marc-Oliver Pahl
...
We will build the setup iteratively. So keep all components you connect next on the board. We will use them later again.
2013-07-02 22:26:00: Marc-Oliver Pahl
2013-07-02 15:11:45: Marc-Oliver Pahl
2013-07-02 15:09:35: Marc-Oliver Pahl
2013-07-02 15:09:07: Marc-Oliver Pahl
...
Reacting to buttons
In this part the task is to set up a button on the breadboard and having the Arduino to react when the button gets pushed.
Plugging the hardware on the breadboard
Required parts
- Breadboard
- LED
- 150 Ω Resistor for the LED (colors: brown, green, brown and gold)
- mechanical switch (blue push button)
- ~10kΩ Resistor (pull-up resistor)
- Jumper wires
- Arduino Board
Circuit diagram
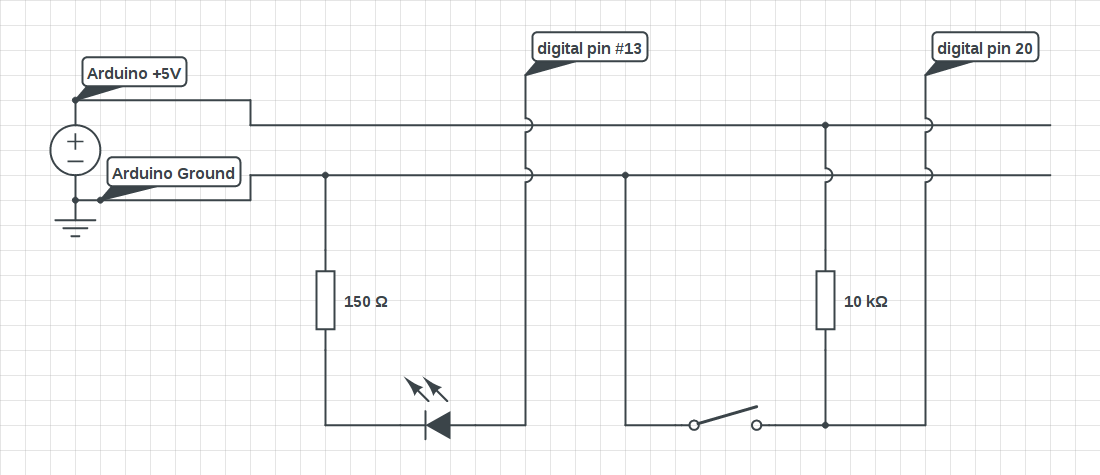
Photo of the setup
Despite the picture the LED should be connected to 13.
Load demo code
Open the "StateChangeDetection" demo (Open -> Digital -> StateChangeDetection). Change the const int buttonPin in line 29 to value 20 (we will use the button at pin 20 again in a later program). Compile and upload it onto the Arduino. You should now be able to turn the LED on and off via the button.
2013-06-27 00:52:38: Marc-Oliver Pahl
2013-06-20 09:08:50: Johann Dichtl
2013-06-19 21:17:08: Johann Dichtl
2013-06-19 21:14:08: Johann Dichtl
...
2013-06-12 14:26:27: Marc-Oliver Pahl
2013-06-12 14:21:51: Marc-Oliver Pahl - created -
2013-07-02 15:27:15: Marc-Oliver Pahl
2013-07-02 15:22:48: Marc-Oliver Pahl
2013-07-02 15:21:09: Marc-Oliver Pahl - created -
We will build the setup iteratively. So keep all components you connect next on the board. We will use them later again.
2013-07-02 22:26:00: Marc-Oliver Pahl
2013-07-02 15:11:45: Marc-Oliver Pahl
2013-07-02 15:09:35: Marc-Oliver Pahl
2013-07-02 15:09:07: Marc-Oliver Pahl
...
Light Sensor (Photo Diode)
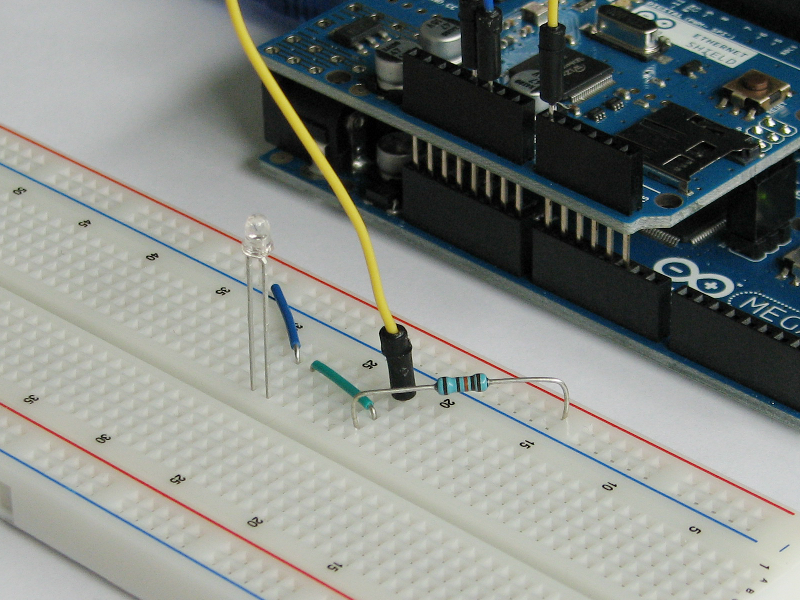
The light sensor works similar to the temperature sensor: the resistance of the sensor depends on the physical property that we want to measure. Consequently, the circuit is very similar to the one use in conjunction with the temperature sensor. Just the resistance values are different.
Required parts
- Arduino
- Breadboard
- Phototransistor (SFH 309)
- Jumper Wires
- 113kΩ resistor (if this one is not available use a 100kΩ resistor instead)
The circuit can be tested with the "Smoothing" demo application (open -> analog -> smoothing) from the Arduino IDE. Make sure that the application and the circuit are using the same pin configuration. Just as it was with the temperature resistor you should see how the value changes, depending on how much light the sensor measures.
Circuit diagram
Photo of the setup
2013-12-12 16:19:05: Fabian Oehlmann
2013-07-06 13:44:17: Marc-Oliver Pahl
2013-07-06 13:43:25: Marc-Oliver Pahl
2013-06-27 13:50:22: Marc-Oliver Pahl
...
We will build the setup iteratively. So keep all components you connect next on the board. We will use them later again.
2013-07-02 22:26:00: Marc-Oliver Pahl
2013-07-02 15:11:45: Marc-Oliver Pahl
2013-07-02 15:09:35: Marc-Oliver Pahl
2013-07-02 15:09:07: Marc-Oliver Pahl
...
From the previous section your Smart Device contains:
- 1x LED
- 1x Temperature Sensor
- 1x Button
- 1x Light Sensor
2013-12-08 21:38:06: Marc-Oliver Pahl
2013-07-02 22:16:21: Marc-Oliver Pahl
2013-06-19 21:33:43: Johann Dichtl
2013-06-19 16:51:45: Marc-Oliver Pahl
...
Adding a Traffic Light
The provided demo program uses - additional to the current setup - three more LEDs. Use a red, a yellow, and a green LED to realize a traffic light. Connect each LED to a separate PIN of the Arduino. To keep the setup consistent with the symbolic names in the code, we recommend using: pin 5 for the red LED, pin 6 for the yellow LED and pin 7 for the green LED.
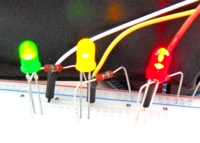
Circuit Diagramm
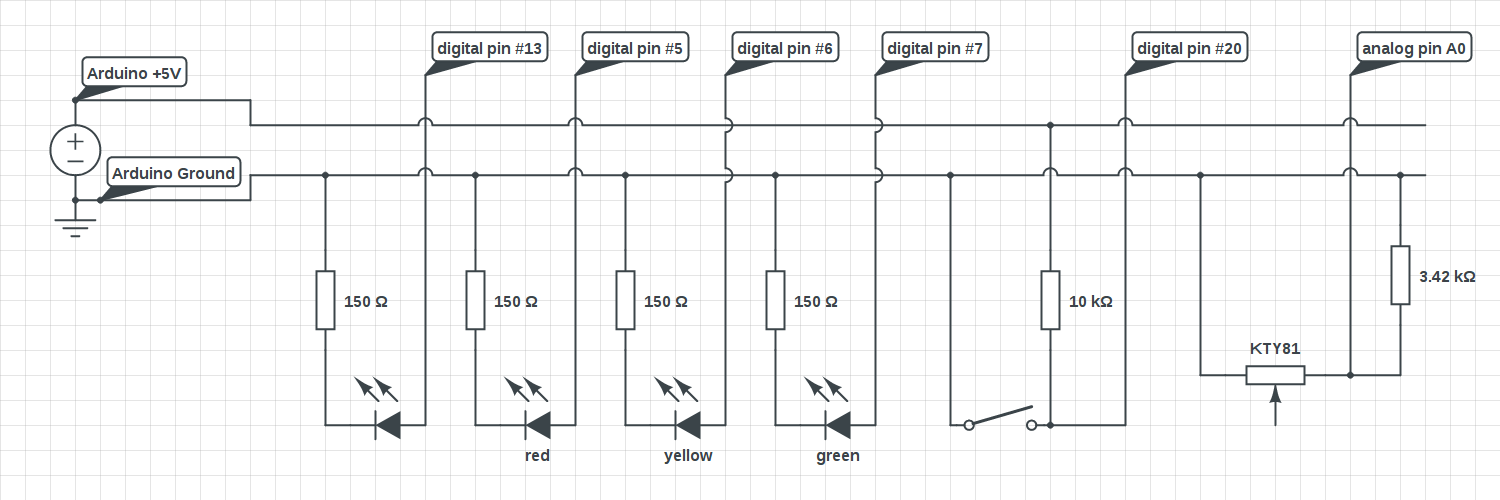
2013-06-27 00:53:42: Marc-Oliver Pahl
2013-06-24 16:19:29: Marc-Oliver Pahl
2013-06-24 16:18:55: Marc-Oliver Pahl
2013-06-19 22:09:48: Johann Dichtl
...
We will orchestrate the traffic light with software later. Optionally you can make it running directly on the Arduino on the next page...
2013-07-02 15:32:45: Marc-Oliver Pahl
2013-07-02 15:32:02: Marc-Oliver Pahl - created -
Optionally add more components
In the remainder of the lab we will create a high level orchestration workflow that is based on our DIY Arduino-based smart device.
One workflow is fixed. It is setting the traffic light indicators based on the current system load. The requirement from the other workflow on you is only that it includes all remaining sensors and actuators on the board.
Imagine, the Arduino sensors are distributed in your room and the LEDs are real lamps or devices like a heater, or a fan.
Do you have ideas for cool orchestration workflows? We will write them down soon but let us first complete the hardware "manufacturing". Do you need more peripherals than we connected already?
Maybe you have some scenarios in mind that make use of more buttons, more LEDs, more temperature sensors, the light sensor, ... if so add some more items...
As you know now how to connect hardware to the Arduino board you are free to customize your Smart Device with additional peripherals.
Add what you want in the quantity you like.
You will be able to realize more cool functionality when you add some more things here. The minimum necessary components are on the board now.
When you added your additional (optional) components the hardware part of this lab is done...
2013-12-11 18:15:35: Fabian Oehlmann
2013-12-08 22:08:04: Marc-Oliver Pahl
2013-12-08 22:05:12: Marc-Oliver Pahl
2013-07-02 15:46:06: Marc-Oliver Pahl
...
Each PC will offer:
 - Load of a Machine (in)
 - Amount of Logged-in Users at a Machine (in)
 - Uptime of a Machine (in)

Your Smart Device offers:
 - Timer (out/ in (trigger)) [timer_0]
 - Timer (out/ in (trigger)) [timer_1]
 - ... (your completion of the list)
List of uploaded files
2013-12-11 11:28:47: Marc-Oliver Pahl
2013-12-11 11:28:17: Marc-Oliver Pahl
2013-07-03 20:05:12: Marc-Oliver Pahl
2013-07-03 20:04:19: Marc-Oliver Pahl
...
Do you want to have a break?
For the following parts you will need your hardware setup so you should only break here or you have to setup the hardware next time again.
If you leave, do not forget to collect the logs for the performance measurement.
2013-07-08 13:31:55: Marc-Oliver Pahl
2013-07-08 13:02:58: Marc-Oliver Pahl
2013-07-08 13:01:29: Marc-Oliver Pahl - created -
5.1. Our Own "Firmware"
So far we used the demo programs for testing the functionality of the Arduino. Maybe you looked into the code a bit already. In this part we will have a closer look at a more complex code. We will write our own firmware that allows us to remotely control our smart device over the Ethernet port of the Arduino.
Our goal in this part is to have our smart device that is accessible over the Ethernet port using our own protocol. Therefore we will continue with our own code in the IDE.
Download the following template in the IDE:
In the IDE, set the Baud rate of the serial monitor according to the rate set in the template, if they do not match already.
Deploy the our template to the Arduino.
If the Arduino seems crashed when uploading the you should reboot it. It typically blinks on upload.
2013-12-12 16:46:44: Marc-Oliver Pahl
2013-12-11 19:17:39: Marc-Oliver Pahl
2013-12-11 10:45:56: Marc-Oliver Pahl
2013-12-11 10:31:12: Marc-Oliver Pahl
...
The Arduino will auto configure its address via DHCP. Let's quickly set up a dhcp on PC5 on eth2 for that purpose.
Edit the /etc/dhcp/dhcpd.conf as follows:
- Add the smallest subnet with the address
10.1.2.3in it. - Use the highest IP in the subnet as gateway (running the dhcp server).
- Specify that
dhcpdshould use all available addresses.
If you encounter problems with the DHCP check if there are firewall (iptables)
rules that prevent to happen what you want to do...
If you use more than one Arduino use the following 10.1.2... subnet for the next Arduinos.
2013-07-03 20:37:37: Marc-Oliver Pahl
2013-07-03 20:19:16: Marc-Oliver Pahl
2013-07-02 16:20:05: Marc-Oliver Pahl
2013-07-02 16:20:00: Marc-Oliver Pahl
...
dhcpd.conf.
2013-06-19 17:14:38: Deniz Ugurlu
2013-06-11 17:59:27: Marc-Oliver Pahl
2013-06-11 17:55:37: Marc-Oliver Pahl
2013-06-11 17:49:37: Marc-Oliver Pahl
...
Starting the dhcp server
The framework for the arduino given to you obtains the IP address via dhcp. So start the dhcpd on the machine you connected the network interface of the arduino to.
Do not forget to bring the interface configured with the highest IP in your subnet
configured up before starting dhcpd...
To find the dhcpd just enter which dhcpd in the console.
2013-07-02 16:26:48: Marc-Oliver Pahl
2013-07-02 16:26:31: Marc-Oliver Pahl
2013-06-24 16:53:33: Marc-Oliver Pahl
2013-06-24 16:53:05: Marc-Oliver Pahl
...
Connecting the Arduino
When you connect the Arduino to the Ethernet port now you should see in the Arduino console
and in the syslog that the Arduino obtains an address.
Press the red reset button to restart the Arduino and make it obtain a new IP if needed.
The console output of the Arduino IDE contains debug output...
2013-07-02 16:29:28: Marc-Oliver Pahl
2013-07-02 16:28:36: Marc-Oliver Pahl
2013-07-02 16:28:05: Marc-Oliver Pahl
2013-07-02 16:26:54: Marc-Oliver Pahl - created -
...
Discovering your Smart Device
In a real world setup it is realistic that you do not have access to the logs of your dhcp server and also not to the Smart Device itself as it has no user interface and is reachable via network only.
Let's assume you would not know the IP of the device but you would know that it will listen
on port 15002. Can you think of a way to find the IP with an nmap
portscan?
Hint: the more you limit the scope of the scan, the faster it is...
Now use grep to let the shell return you only the relevant information of the
host that has port 15002 open.
2013-06-11 18:05:49: Marc-Oliver Pahl
2013-06-11 18:03:17: Marc-Oliver Pahl - created -
2013-07-30 13:18:33: Marc-Oliver Pahl
2013-06-24 16:40:29: Marc-Oliver Pahl
2013-06-24 16:40:11: Marc-Oliver Pahl
2013-06-11 18:45:31: Marc-Oliver Pahl
...
Test the connection
Now test the connection to the arduino using telnet. When you enter
"@hello" the arduino should respond...
Do not forget to use the right port...
2013-07-03 11:55:55: Marc-Oliver Pahl
2013-07-03 11:55:32: Marc-Oliver Pahl
2013-07-02 17:27:40: Marc-Oliver Pahl
2013-07-02 16:36:08: Marc-Oliver Pahl
...
We will walk through the code now, so take a look at it while reading here.
Like every Arduino sketch, this code has a setup and a loop function. Both are automatically executed at startup.
2013-12-09 16:03:17: Marc-Oliver Pahl
2013-12-09 16:01:23: Marc-Oliver Pahl
2013-06-20 11:07:42: Marc-Oliver Pahl
2013-06-20 10:46:06: Marc-Oliver Pahl
...
The Setup Function
The setup function takes care of initializing the I/O pins that are used by
the program. Modify the code to meet your needs and hardware layout.
The interrupt handler for the button is also registered in the setup function.
The Loop Function
As the name says the loop function is looping during run time of the Arduino. In our case it only calls the message handler when the "@" that is used as identifier for our protocol is the starting character.
The "@" is used as protocol identifier here. Even though it is on the application layer it has the same functionality like the next header field in IPv6 for instance...
2013-07-02 16:57:33: Marc-Oliver Pahl
2013-07-02 16:56:59: Marc-Oliver Pahl
2013-07-02 16:56:33: Marc-Oliver Pahl - created -
Our Button Implementation (different from the demo)
The button makes use of an Arduino feature called "external interrupt". It allows the software to react on external signal by calling a function when a predefined condition is met, for example "RISING" (the pin input changes from LOW to HIGH) or "FALLING" (the pin input changes from HIGH to LOW). Only a few pins are supported by external interrupts - on the Arduino Mega these are the pins 2, 3, 18, 19, 20 and 21.We make use of this feature for two reasons. First, polling the button state in our main loop is a bad idea, because in general we don't know how long one loop iteration may take. So in worst case we might not register a button state change if it chages back to its original state quick enough. Second, polling the button state in a busy loop is bad design and not needed at all in our case.
Theoretically, we could use the same technique to react to incoming TCP message, but the provided library does not support this feature, as the Arduino website mentions:
The interupt is registered to react on "CHANGE" events, i.e. when the input signal changes from HIGH to LOW or vice versa. Every time the board detects a signal change, the function switchInterruptHandler is called. A static counter is increased, to keep track of the button state. Assuming that the button is not pushed at startup, pushing the button will set pin 8 to HIGH and pushing it again will set pin 8 back to LOW, while releasing the button does not change the state of pin 8 at all. The function also "de-bounces" the button. Bouncing in this context refers to a short burst of state changes when the button is pushed or released. See wikipedia: Contact bounce for more information about bouncing.
If you want to see the state change of pin 8, you can add another LED to your circuit that receives its current from pin 8.
2013-06-20 11:10:04: Marc-Oliver Pahl
2013-06-20 11:07:49: Marc-Oliver Pahl - created -
What is the use of this code fragment in the button implementation?
        if( time_now - time_last_interrupt < 15 ) {
                return;
        }
Why does it make sense to add button_state++;? (Hint: Think on asynchronous
polling.)
Now it is time to extend the network communication protocol on your device to give access to all peripherals over the network.
2013-12-09 16:18:45: Marc-Oliver Pahl
2013-12-08 22:12:30: Marc-Oliver Pahl
2013-07-02 17:37:48: Marc-Oliver Pahl
2013-07-02 17:16:40: Marc-Oliver Pahl
...
Providing Access to the Peripherals over the Protocol
The template provides you with basic functionality:
- It obtains an IP address.
- It has message handlers for timers that we will use later.
All functionality except the one for the yellow and the green LED and your added peripherals is included already.
The access to most peripherals is straight forward. For all entity classes you find an implementation already.
2013-12-11 10:58:09: Marc-Oliver Pahl
2013-12-11 10:57:44: Marc-Oliver Pahl
2013-12-11 10:48:52: Marc-Oliver Pahl
2013-07-03 20:40:42: Marc-Oliver Pahl
...
Check that you connected all peripherals to the right pins as listed in the code.
Call the @hello command and try the returned commands. Everything should work
except the commands for the yellow and green LED and you additional peripherals.
The goal of this part is to make the smart device offer all functionality advertised by the hello message plus the functionality needed for your peripherals.
2013-12-11 11:15:52: Marc-Oliver Pahl
2013-12-11 11:05:25: Marc-Oliver Pahl
2013-12-11 11:04:36: Marc-Oliver Pahl - created -
2013-12-09 16:23:42: Marc-Oliver Pahl
2013-12-09 16:20:44: Marc-Oliver Pahl
2013-12-09 16:19:41: Marc-Oliver Pahl - created -
PIN_OUT_COUNT, enum pin_id_e,
and int pin_out_table[PIN_OUT_COUNT]? Is the order of the entries relevant?
2013-12-12 14:40:37: Marc-Oliver Pahl
2013-12-11 10:42:35: Marc-Oliver Pahl
2013-12-11 10:41:30: Marc-Oliver Pahl
2013-12-09 16:24:52: Marc-Oliver Pahl
...
When providing remote access, the communication protocol is fundamental. In this lab we will use a simple communication protocol that only consists of extracting bytes from a TCP stream. For resource limited devices such a protocol is realistic.
The communication protocol is parsed with a call to parseInput, which uses a simple state machine. The protocol is further parsed with the rest of the parse* functions like, for example, parseReadGet.
Other approaches for protocol parsing could be lookup tables or regular expressions. Our chosen approach fits the tight memory restrictions, in particular in terms of RAM.
The implemented protocol supports the following commands already:
- @hello: returns info about the device
- @set:timer_{0,1}: sets the timer to the current time (value returned by a call to millis)
- @get:timer_{0,1}: returns the value of the resource
The "@" is used as identifier for the protocol. It helps distinguishing sent and received data in the telnet window as a side effect...
2013-12-11 11:31:37: Marc-Oliver Pahl
2013-12-11 11:22:41: Marc-Oliver Pahl
2013-07-03 11:55:11: Marc-Oliver Pahl
2013-07-02 23:44:39: Marc-Oliver Pahl
...
The Parser Buffer
When working with the parser you have to mind the length of the string you parse. It has to be decreased to zero at the end of your parsing.
Make sure you do not write over the length of the buffer. If you do so you have a classical buffer overflow and thing you do not want happen... you overwrite the state of the parser... boom...
2013-07-03 21:33:42: Marc-Oliver Pahl
2013-07-03 21:33:19: Marc-Oliver Pahl
2013-07-03 21:32:45: Marc-Oliver Pahl
2013-07-03 21:30:10: Marc-Oliver Pahl - created -
...
Parsing Function
The message parsing happens here:
/* reads from the parse buffer, expecting a command token or line break. valid command tokens
 * are: "hello", "get" and "set"
 *
 * parameter:
 *              ptr                     pointer to a parser_t structure
 *
 * note (1): reads from the global 'client' variable
 * note (2): this function guarantees that the buffer length on returning will be shorter than before
 *
 * returns:
 *              1               read successfull
 *              0               error (e.g. token incomplete)
 */
int parserReadCmd( void *ptr ) {
        parser_t        *parser = (parser_t*)ptr;               // dealing with the automatic function declaration of the IDE
        char            token[32];                                              // used for printing a debug message

        if( parser->length == 0 )
                return 0;

        parser->buffer[parser->length] = 0;
        Serial.println( F("parser buffer:") );          // debug message to the serial console
        Serial.println( parser->buffer );

        if( !parserStrcmp(parser, "get:") ) {
                parser->state = PARSER_GET;
                parser->length -= 4;
                memmove( parser->buffer, parser->buffer+4, parser->length );
                return 1;
        } else if( !parserStrcmp(parser, "set:") ) {
                parser->state = PARSER_SET;
                parser->length -= 4;
                memmove( parser->buffer, parser->buffer+4, parser->length );
                return 1;
        } else if( !parserStrcmp(parser, "hello") ) {
                parser->state = PARSER_INIT;
                parser->length -= 5;
                memmove( parser->buffer, parser->buffer+5, parser->length );
                client.println( F("Possible commands: @hello;@get:{timer_0,timer_1,switch,temp,led_red,led_yellow,led_green};@set:{timer_0,timer_1,led_red,led_yellow,led_green}=[value]") );
                return 1;
        } else if( !parserStrcmp(parser, "\n")  ||  !parserStrcmp(parser, "\r") ) {
                // line break and carriage return are just used as end-of-command tokens and are ignored here
                parser->length -= 1;
                memmove( parser->buffer, parser->buffer+1, parser->length );
                return 1;
        } else {
                Serial.print( F("error - unrecognized command token:") );
                memset( token, 0, sizeof(token) );
                memmove( token, parser->buffer, sizeof(token) < parser->length ? sizeof(token)-1 : parser->length );
                Serial.println( token );

                parser->length = 0;             // error handling: buffer is completly purged
        }

        return 0;
}
Add identifiers for all your peripherals to be returned by the hello message.
2013-12-11 11:29:42: Marc-Oliver Pahl
2013-12-11 11:24:02: Marc-Oliver Pahl
2013-07-03 21:58:29: Marc-Oliver Pahl
2013-07-03 11:34:31: Marc-Oliver Pahl
...
2013-12-11 11:03:54: Marc-Oliver Pahl
2013-12-11 11:02:35: Marc-Oliver Pahl - created -
@hello call.
2013-12-11 11:04:21: Marc-Oliver Pahl
2013-12-11 11:02:49: Marc-Oliver Pahl - created -
Your Protocol Message Handlers
Now it is time to implement the message handlers for the yellow and the green LED and your peripherals.
Some peripherals can be read out directly like the temperature sensor.
Others need more programming logic as their state is not directly retrievable for some reasons.
2013-07-03 11:58:31: Marc-Oliver Pahl
2013-07-03 11:56:34: Marc-Oliver Pahl - created -
Making the State of the LEDs Accessible
If a pin is configured for output it cannot be used as input anymore.
To obtain the state of an output (e.g. a LED in our setup) it is therefore necessary to save the current state (HIGH, LOW) in a variable in the program and return this variable on request.
Variables for holding the state are already in the code.
2013-07-03 22:04:29: Marc-Oliver Pahl
2013-07-02 19:02:23: Marc-Oliver Pahl
2013-06-20 11:13:03: Marc-Oliver Pahl
2013-06-20 11:11:28: Marc-Oliver Pahl
...
GET Handler
The GET handler handles the get protocol messages.
/* reads from the parse buffer, expecting a resource identifier
 *
 * parameter:
 *              ptr                     pointer to a parser_t structure
 *
 * returns:
 *              1               success
 *              0               error
 */
int parserReadGet( void *ptr ) {
        parser_t        *parser = (parser_t*)ptr;               // dealing with the automatic function declaration of the IDE
        char            token[32];
        int                     id;
        char            *end_ptr;

        parser->state = PARSER_INIT;
        Serial.println( F("parserReadGet") );
        if( !parserStrcmp(parser, "timer_") ) {
                id = strtol( parser->buffer+6, &end_ptr, 10 );
                if( end_ptr == parser->buffer+6 ) {
                        client.println( "error: invalid timer index");
                        return 0;
                }
                memmove( parser->buffer, end_ptr, parser->length - (end_ptr - parser->buffer) );
                sendTimer( id );
                return 1;
        }
        if( !parserStrcmp(parser, "switch") ) {
                parser->length -= 6;
                memmove( parser->buffer, parser->buffer+6, parser->length );
                sendValue( SWITCH );
                return 1;
        }
        if( !parserStrcmp(parser, "temp") ) {
                parser->length -= 4;
                memmove( parser->buffer, parser->buffer+4, parser->length );
                sendValue( SENSOR_TEMP );
                return 1;
        }
        if( !parserStrcmp(parser, "led_red") ) {
                parser->length -= 7;
                memmove( parser->buffer, parser->buffer+7, parser->length );
                sendValue( LED_RED );
                return 1;
        }

/**
 * =======================================================================================
 * TODO (iLab2):
 *      (3) Implement the message handling to get and set the state of your peripherals.
 *          ! Make sure the buttons and the LEDs have a useful implementation to retrieve
 *          their state.
 *   Implement the GET message handlers to access the state of your devices.
 * =======================================================================================
 */

        client.println( "error: unrecognized resource identifier" );
        return 0;
}
Add code to get the states of all your peripherals via the protocol.
2013-07-03 22:07:07: Marc-Oliver Pahl
2013-07-03 22:06:13: Marc-Oliver Pahl
2013-07-02 17:24:12: Marc-Oliver Pahl
2013-07-02 17:23:23: Marc-Oliver Pahl
...
SET handler
The SET handler handles the set protocol messages.
/* reads from the parse buffer, expecting a resource identifier
 *
 * parameter:
 *              ptr                     pointer to a parser_t structure
 *
 * returns:
 *              1               success
 *              0               error
 */
int parserReadSet( void *ptr ) {
        parser_t        *parser = (parser_t*)ptr;               // dealing with the automatic function declaration of the IDE
        char            token[32];
        int                     id;
        char            *end_ptr;

        parser->state = PARSER_INIT;
        Serial.println( "parserReadSet" );

        if( !parserStrcmp(parser, "timer_") ) {
                id = strtol( parser->buffer+6, &end_ptr, 10 );
                if( end_ptr == parser->buffer+6 ) {
                        client.println( "error: invalid timer index");
                        return 0;
                }
                parser->length -= (end_ptr - parser->buffer);
                memmove( parser->buffer, end_ptr, parser->length );
                setTimer( id );
                return 1;
        }
        if( !parserStrcmp(parser, "led_red=") ) {
                parser->length -= 8;
                memmove( parser->buffer, parser->buffer+8, parser->length );
                return setValue( ptr, LED_RED );
        }

/**
 * =======================================================================================
 * TODO (iLab2):
 *      (3) Implement the message handling to get and set the state of your peripherals.
 *          ! Make sure the buttons and the LEDs have a useful implementation to retrieve
 *          their state.
 *   Implement the SET message handlers to access the state of your devices.
 * =======================================================================================
 */

        client.println( "error: unrecognized resource identifier" );
        return 0;
}
Add code to set the states of all your peripherals via the protocol.
2013-07-03 22:10:01: Marc-Oliver Pahl
2013-07-03 22:08:52: Marc-Oliver Pahl
2013-07-02 17:23:57: Marc-Oliver Pahl
2013-07-02 17:22:58: Marc-Oliver Pahl
...
Make sure that all getter and setter are implemented and everything works.
All of your peripherals should be supported. You find them as reminder in the following list again:
2013-12-11 13:03:06: Marc-Oliver Pahl
2013-12-11 13:01:54: Marc-Oliver Pahl - created -
Each PC will offer:
 - Load of a Machine (in)
 - Amount of Logged-in Users at a Machine (in)
 - Uptime of a Machine (in)

Your Smart Device offers:
 - Timer (out/ in (trigger)) [timer_0]
 - Timer (out/ in (trigger)) [timer_1]
 - ... (your completion of the list)
List of uploaded files
2013-12-11 11:28:47: Marc-Oliver Pahl
2013-12-11 11:28:17: Marc-Oliver Pahl
2013-07-03 20:05:12: Marc-Oliver Pahl
2013-07-03 20:04:19: Marc-Oliver Pahl
...
Your hello message should return the commands to interact with all peripherals, and all the commands your hello message returns should work:
2013-12-11 11:48:38: Marc-Oliver Pahl
2013-12-11 11:48:05: Marc-Oliver Pahl
2013-12-11 11:44:17: Marc-Oliver Pahl
2013-06-11 22:30:35: Marc-Oliver Pahl
...
@hello call.
2013-12-11 11:04:21: Marc-Oliver Pahl
2013-12-11 11:02:49: Marc-Oliver Pahl - created -
Now make a diff between your implementation and the original template.
Make sure that you do not overwrite your code accidentally when downloading the template again.
2013-12-11 19:06:26: Fabian Oehlmann
2013-12-11 11:48:53: Marc-Oliver Pahl
2013-12-11 11:47:46: Marc-Oliver Pahl - created -
enum pin_id_e.
int pin_out_table[PIN_OUT_COUNT].
2013-12-13 14:22:41: Marc-Oliver Pahl
2013-12-11 16:03:47: Marc-Oliver Pahl
2013-12-11 16:03:21: Marc-Oliver Pahl
2013-12-11 15:12:49: Marc-Oliver Pahl - created -
parserReadGet( void *ptr ) function.
parserReadSet( void *ptr ) function.
void sendValue( int id ) function.
int setValue( void *ptr, int id )
function.
Upload your entire Arduino code here.
List of uploaded files
2013-12-12 16:47:39: Marc-Oliver Pahl
2013-12-11 16:11:26: Marc-Oliver Pahl
2013-12-11 16:09:48: Marc-Oliver Pahl
2013-12-11 14:49:53: Marc-Oliver Pahl
...
Testing Remote Access via Telnet
Since the demo protocol is text based, it is easy to test the protocol using telnet. Open a terminal and connect to the device via telnet. The box below shows a short telnet session, including the requests and the replies. Your commands should behave similar to our test here.
telnet 10.1.2.1 15002
Trying 10.1.2.1...
Connected to 10.1.2.1.
Escape character is '^]'.
@hello
Possible commands: @hello;@get:{timer_0,timer_1};@set:{timer_0,timer_1}=[value]
@set:led_red=1
set=1
@set:led_green=1
set=1
@set:led_yellow=1
set=1
@get:switch
switch=0
@get:temp
temp=172
Does your protocol work as expected? What happens if your request command contains a typo? You can also test the protocols with tools like curl or netcat, if you like.
2013-07-02 23:46:35: Marc-Oliver Pahl
2013-07-02 23:45:44: Marc-Oliver Pahl
2013-07-02 17:44:36: Marc-Oliver Pahl
2013-06-24 16:55:58: Marc-Oliver Pahl
...
2013-06-24 16:57:05: Marc-Oliver Pahl
2013-06-24 16:56:43: Marc-Oliver Pahl - created -
2013-07-03 11:59:11: Marc-Oliver Pahl
2013-07-03 11:32:44: Marc-Oliver Pahl
2013-06-11 22:29:39: Marc-Oliver Pahl
2013-06-11 22:29:39: Marc-Oliver Pahl
...
2013-07-03 11:59:21: Marc-Oliver Pahl
2013-07-03 11:32:56: Marc-Oliver Pahl
2013-06-11 22:30:02: Marc-Oliver Pahl
2013-06-11 22:29:07: Marc-Oliver Pahl - created -
Do you want to have a break?
For the following parts you will need your hardware setup so you should only break here or you have to setup the hardware next time again.
If you leave, do not forget to collect the logs for the performance measurement.
2013-07-08 13:31:55: Marc-Oliver Pahl
2013-07-08 13:02:58: Marc-Oliver Pahl
2013-07-08 13:01:29: Marc-Oliver Pahl - created -
Which Scenario(s) do you Want to Realize Later?
In this lab we want to connect the cyber world in the computer with the physical world. This page is about your orchestration scenario.
Invent a workflow that uses our Smart Device that you want to realize later.
Be creative! Your imagination is only limited by the hardware you create here. In this lab we will make the sensors and actuators you put on your Smart Device easily accessible via software. Additionally you will have access to the load of all PCs involved, the users logged in and the uptime of the machines.
Following you find the list of your peripherals again.
2013-12-11 13:56:15: Marc-Oliver Pahl
2013-12-11 13:55:43: Marc-Oliver Pahl
2013-12-11 13:52:47: Marc-Oliver Pahl
2013-07-02 15:36:19: Marc-Oliver Pahl
...
Each PC will offer:
 - Load of a Machine (in)
 - Amount of Logged-in Users at a Machine (in)
 - Uptime of a Machine (in)

Your Smart Device offers:
 - Timer (out/ in (trigger)) [timer_0]
 - Timer (out/ in (trigger)) [timer_1]
 - ... (your completion of the list)
List of uploaded files
2013-12-11 11:28:47: Marc-Oliver Pahl
2013-12-11 11:28:17: Marc-Oliver Pahl
2013-07-03 20:05:12: Marc-Oliver Pahl
2013-07-03 20:04:19: Marc-Oliver Pahl
...
Using the overview of available interaction points with the real world define an interesting workflow that you would like to realize in this lab. Include at least one dynamic input element (either in hardware, e.g. lightsensor, or in software, e.g. load) that triggers an action that you can test at the end.
2013-12-11 13:56:36: Marc-Oliver Pahl
2013-06-12 12:21:23: Marc-Oliver Pahl
2013-06-12 12:18:57: Marc-Oliver Pahl - created -
... 20:09:16 Marc-Oliver Pahl
2013-12-11 13:58:45: Marc-Oliver Pahl
2013-07-30 13:17:28: Marc-Oliver Pahl
2013-06-24 16:28:03: Marc-Oliver Pahl
...
2013-07-30 13:17:39: Marc-Oliver Pahl
2013-06-24 16:27:02: Marc-Oliver Pahl
2013-06-12 12:28:24: Marc-Oliver Pahl
2013-06-12 12:27:14: Marc-Oliver Pahl
...
2013-07-08 13:31:55: Marc-Oliver Pahl
2013-07-08 13:02:58: Marc-Oliver Pahl
2013-07-08 13:01:29: Marc-Oliver Pahl - created -
Now the results of our initial performance measurement should be available.
Go to the measurementControl screen and check that the measurement ended:
Collected 49 of minimum required 50
16:34:12.585 [I] [MeasurementCont] Running with 1/250 clients.
[...]
Appending log to vset-clients-0001_nr-0001_1386603253_delayLog_-pc5.5-mCl43.log...
16:34:18.253 [I] [MeasurementCont] Adding log /pc5.5/mCl43/delayLog.
Wrote log vset-clients-0001_nr-0001_1386603253_delayLog_-pc5.5-mCl43.log
Appending log to vset-clients-0001_nr-0001_1386603253_throughputLog_-pc5.5-mCl43.log...
16:34:18.344 [I] [MeasurementCont] Adding log /pc5.5/mCl43/throughputLog.
Wrote log vset-clients-0001_nr-0001_1386603253_throughputLog_-pc5.5-mCl43.log
Collected 50 of minimum required 50
Pack all logs and upload the tar below. We will evaluate the results later.
tar -czvf measurementLogs.tar.gz ~/ds2os/*.log
2013-12-09 17:00:23: Marc-Oliver Pahl
2013-12-09 16:54:13: Marc-Oliver Pahl
2013-12-09 16:53:26: Marc-Oliver Pahl
2013-12-09 16:52:18: Marc-Oliver Pahl
...
List of uploaded files
2013-12-13 14:20:13: Marc-Oliver Pahl
2013-12-09 17:16:23: Marc-Oliver Pahl
2013-12-09 16:57:35: Marc-Oliver Pahl
2013-12-09 16:57:31: Marc-Oliver Pahl
...
Make sure you really archived the logs as they will be deleted automatically by the deploy scripts later.
2013-12-09 16:56:18: Marc-Oliver Pahl
2013-12-09 16:55:24: Marc-Oliver Pahl - created -
Stop all Services
As we do not need the measurement client services anymore, we will "stop" the performance measurement services by issuing on the machine where you put the deployment scripts:
./killAll
Make sure no DS2OS related services are running anymore.
Do you want to have a break?
The following parts are not connected to what you did so far. So if you want to stop now or have a break, now is a good time.
2013-07-08 13:31:55: Marc-Oliver Pahl
2013-07-08 13:02:58: Marc-Oliver Pahl
2013-07-08 13:01:29: Marc-Oliver Pahl - created -
Now you successfully tested your Smart Device and made it accessible via the network. Next we will connect your Smart Device with the Virtual State Layer (VSL) middleware.
As you read in the prelab devices are connected to the middleware via so-called Gateway Services. The task of the Gateway Services is to provide abstract interfaces to devices.
The abstract interfaces of the VSL are called Models.
2013-06-10 13:27:45: Marc-Oliver Pahl
2013-06-10 13:25:06: Marc-Oliver Pahl
2013-06-05 15:36:08: Deniz Ugurlu - created -
Deploying all Necessary DS2OS Software
For convenience reasons you can run the following shell script. It deploys all necessary software packets for this lab automatically to all running computers and it sets the default gw there. The script is part of the deployDS2OS.tar.gz that we used here already.
On any PC as root execute:
./deployDevPartAll.sh
After running the script you find the Knowledge Agents, the Models, and the service
template in the grml user's ~/ds2os
There is also a run that you can use (./run) to start the agent
with the console if you do not want to type java -jar ds2os.jar --console all
the time.
2013-12-11 16:28:04: Marc-Oliver Pahl
2013-12-11 16:25:17: Marc-Oliver Pahl
2013-12-11 16:20:27: Marc-Oliver Pahl
2013-07-17 19:01:47: Marc-Oliver Pahl
...
As you read in the prelab each service has a VSL context Model.
Next we will create the VSL context Model to your device.
Each PC will offer:
 - Load of a Machine (in)
 - Amount of Logged-in Users at a Machine (in)
 - Uptime of a Machine (in)

Your Smart Device offers:
 - Timer (out/ in (trigger)) [timer_0]
 - Timer (out/ in (trigger)) [timer_1]
 - ... (your completion of the list)
List of uploaded files
2013-12-11 11:28:47: Marc-Oliver Pahl
2013-12-11 11:28:17: Marc-Oliver Pahl
2013-07-03 20:05:12: Marc-Oliver Pahl
2013-07-03 20:04:19: Marc-Oliver Pahl
...
Creating a Model for your Smart Device
A Model is a simple xml file as shown for light.xml in the next
paragraph. To inherit it and to set access rights, the following reference can be made in
another model:
<light>
  <isOn reader="*">
    <desired reader="*" writer"*"></desired>
  </isOn>
</light>
The reader and writer attributes specify who may access the node.
By default only the creator of the instance (your Gateway Service) has full access
to the nodes. Defining additional access rights for * means that any ID can access.
As we do not focus on the access control in our lab simply set the access in the necessary directions only to *.
A node that can only be read like the one given does not need a writer=* for
instance. A writable node (see below) has these access rights in this lab.
2013-12-12 10:28:09: Marc-Oliver Pahl
2013-12-11 16:58:57: Marc-Oliver Pahl
2013-07-02 23:04:58: Marc-Oliver Pahl
2013-07-02 22:58:30: Marc-Oliver Pahl
...
Adding the Necessary Desired Subnodes for the Autonomous Smart Gateways
As you remember from the PreLab DS2OS requires Autonomous Smart Gateways. The reason is that the VSL fully decouples services from each other including the Smart Gateways.
A service will set a desired node in your model and then your gateway will try
to reflect the wish to the reality.
If we have a lamp that we can control from remote our Model should have a
desired node below the state, like
<light>
  <isOn type="/derived/boolean">
    <desired type="/derived/boolean"></desired>
  </isOn>
</light>
Later only the desired node will be publicly writable. The isOn is read-only
for the public. It is set by the SmartGateway only as only it knows the real current
state.
2013-12-12 10:29:58: Marc-Oliver Pahl
2013-12-12 10:29:45: Marc-Oliver Pahl
2013-12-12 10:28:22: Marc-Oliver Pahl
2013-12-11 17:01:17: Marc-Oliver Pahl
...
On PC3...
Create a model that represents your device and paste it here.
Use the following types for your nodes:
- /ilab/led
- /ilab/temperature
- /ilab/button
Remember the information about Multi Inheritance from the PreLab and use it to type the nodes with functionality and with information about the contained data format.
Do not forget to add the desired nodes for nodes that you want to set over
your Smart Gateway.
On the PC with the Model Repository, download the iLab_models.tar.gz and
put the content into the ~/ilab folder on PC3 (the Model repository). Look at
the models that are in the ~/ilab folder now.
Store the following model as ~/ds2os/models/ilab/led.xml:
<led type="/derived/boolean">
    <desired type="/derived/boolean"></desired>
</led>
The Model defines that an /ilab/led has a value of type boolean and a
sub node desired to inform your Smart Gateway about what you want to
set.
The reader and writer settings reflect our desired functionality: only the Smart Gateway as owner of the node can set the actual real world state. Everyone can read it.
The desired value, so what other services want the Smart Gateway to change the reality to, can be set and read by everyone.
Complete the following model (doe not forget to set the access rights as properly as described above):
<smartDevice>
    <temperature type="/ilab/temperature" reader="*"></temperature>
    <button type="/ilab/button" reader="*"></button>
    <ledRed type="/ilab/led" reader="*">
      <desired reader="*" writer"*"></desired>
    </ledRed>

... add your other nodes here ...

    <timer0 type="/ilab/triggerTimer" reader="*">
      <desired writer="*"></desired>
    </timer0>
    <timer1 type="/ilab/triggerTimer" reader="*">
      <desired writer="*"></desired>
    </timer1>
    <vTimer0 type="/ilab/vTimer" reader="*" writer="*"></vTimer0>
    <vTimer1 type="/ilab/vTimer" reader="*" writer="*"></vTimer1>
</smartDevice>
For simplicity reasons we gave the basic data type for the temperature sensor and the button directly. This is also possible via the multi inheritance.
Via the inheritance the ledRed is inheriting all properties from led...
Create your model and store it as ~/ds2os/models/ilab/smartDevice.xml.
You can do this step on any PC.
2014-01-09 12:20:15: Marc-Oliver Pahl
2014-01-09 12:19:33: Marc-Oliver Pahl
2013-12-12 18:03:50: Marc-Oliver Pahl
2013-12-12 17:36:14: Marc-Oliver Pahl
...
2013-12-12 10:36:27: Marc-Oliver Pahl
2013-12-11 22:51:09: Marc-Oliver Pahl
2013-12-11 17:16:36: Marc-Oliver Pahl
2013-07-30 13:35:20: Marc-Oliver Pahl
...
Test your Model on PC3
Now test instantiating your model. Start the Knowledge Agent by calling the
run script in ~/ds2os/.
In the agent console issue:
system@pc6.3: / % cd pc6.3
system@pc6.3: /pc6.3 % add testDevice /ilab/smartDevice
system@pc6.3: /pc6.3 % get testDevice
system@pc6.3: /pc6.3 % get testDevice/*
2013-12-11 17:19:12: Marc-Oliver Pahl
2013-12-11 17:18:33: Marc-Oliver Pahl - created -
Starting a Model Repository
One of the basic requirements for distributed development of smart space software is the sharing of the abstraction. The sharing of the DS2OS models happens via the Model Repository.
After running the setup script , PC3 runs as Model rpository.
We will observe how models get distributed next.
2013-12-11 17:26:13: Marc-Oliver Pahl
2013-07-03 22:43:07: Marc-Oliver Pahl
2013-07-02 18:10:25: Marc-Oliver Pahl
2013-07-02 18:10:12: Marc-Oliver Pahl
...
Testing the deployment of your model from the Model Repository
On PC4 start the Knowledge Agent with the run script.
Start wireshark on the management interface of the PC3 and PC4 to see the packets that are exchanged.
If wireshark detects our protocol as some known protocol switch it off in Analyze->EnabledProtocols.
Now, on PC4 instantiate /ilab/smartDevice as done in the test
before.
2013-07-30 13:31:58: Marc-Oliver Pahl
2013-07-16 11:48:48: Marc-Oliver Pahl
2013-07-03 22:50:35: Marc-Oliver Pahl
2013-07-03 22:46:20: Marc-Oliver Pahl
...
... 20:12:22 Marc-Oliver Pahl
2013-12-11 17:38:08: Deniz Ugurlu
2013-12-11 17:36:00: Deniz Ugurlu
2013-12-11 17:35:05: Marc-Oliver Pahl
...
2013-12-11 17:34:36: Marc-Oliver Pahl
2013-12-11 17:34:28: Marc-Oliver Pahl
2013-12-11 17:33:53: Marc-Oliver Pahl
2013-12-11 17:32:08: Marc-Oliver Pahl
...
Repeating the instantiation
Repeat the experiment. Keep wireshark running. Instantiate your model
/ilab/smartDevice to a new node test2.
Now look at the wireshark stream again. What is different?
2013-07-03 22:53:21: Marc-Oliver Pahl
2013-06-10 15:06:29: Marc-Oliver Pahl
2013-06-10 15:05:31: Marc-Oliver Pahl - created -
... 20:12:45 Marc-Oliver Pahl
2013-12-11 17:37:19: Marc-Oliver Pahl
2013-12-11 17:36:44: Marc-Oliver Pahl
2013-06-10 15:09:01: Marc-Oliver Pahl
...
2013-06-10 15:10:55: Marc-Oliver Pahl
2013-06-10 15:10:45: Marc-Oliver Pahl
2013-06-10 15:09:12: Marc-Oliver Pahl - created -
2013-12-11 17:40:52: Marc-Oliver Pahl
2013-06-10 15:23:36: Marc-Oliver Pahl
2013-06-10 15:20:01: Marc-Oliver Pahl - created -
The Service Template
Now it is time to write Services for DS2OS.
As starting point we use the following service template, tum_ilab_service_template.tar.gz, that was already deployed by the setup script.
As IDE you can use Eclipse. You can import the service template by following the menu
to:
File -> Import -> General -> Existing Projects into Workspace -> Select archive
file -> ~/ds2os/TUM_ilab_service_template.tar.gz
2013-12-11 17:48:30: Marc-Oliver Pahl
2013-12-11 17:47:04: Marc-Oliver Pahl
2013-12-11 17:46:12: Marc-Oliver Pahl
2013-07-04 21:06:47: Marc-Oliver Pahl
...
Linking the right DS2OS.jar
Before starting to program you have to link the ds2os.jar to your project as the connector is sharing communication libraries with it.
To do so click right on the template project you imported into Eclipse. The go to properties at the bottom of the context menu.
Project Context Menu -> Properties -> Resource -> Java Build Path -> Libraries
Remove the ds2os.jar there.
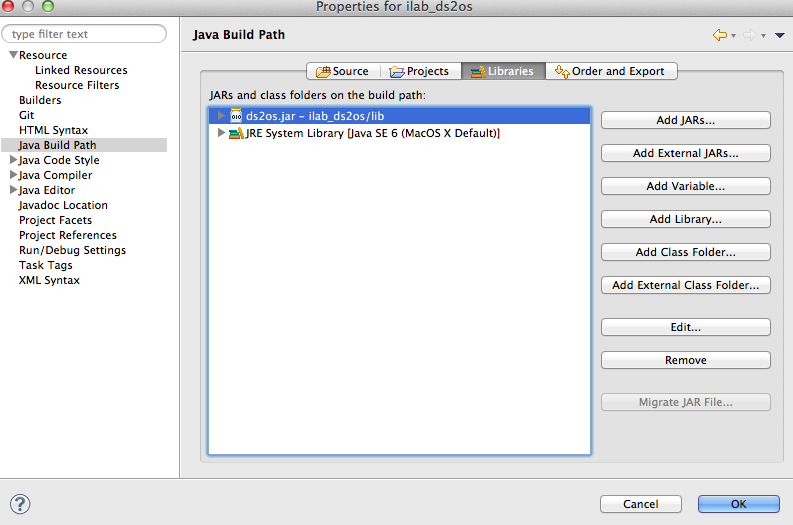
Add the External JAR ~/ds2os/ds2os.jar.
Done.
2013-07-05 14:46:45: Marc-Oliver Pahl
2013-07-05 14:44:54: Marc-Oliver Pahl
2013-07-05 14:43:16: Marc-Oliver Pahl
2013-07-05 14:41:14: Marc-Oliver Pahl
...
Setting up the Formatter
An important principle when developing software is: "It must look nice on t-shirts". One of my programming teachers, Mike "Mr. Preprocessor" Sperber used to tell us this wise advice.
An important aspect besides short, precise coding is formatting. Luckily the IDE can support us in formatting. Therefore let us set up the formatter:
- Right click on the project template project.
- Go to properties - Java Code Style - Formatter
- Check 'Enable project specific settings'
- Import the
formatter.xmlfrom the template's root folder - Apply
- Go to properties - Java Editor - Save Actions
- Check 'Enable project specific settings'
- Make sure that these are checked/selected:
- Perform the selected actions on save
- Format source code
- Format all lines
- Organize imports
- Okay
2013-12-12 16:55:50: Marc-Oliver Pahl
2013-12-12 16:54:19: Marc-Oliver Pahl
2013-12-12 16:52:10: Marc-Oliver Pahl
2013-12-12 16:50:28: Marc-Oliver Pahl
...
Code
Remember the information from the prelab about the two classes and their wiring and handling purpose.
2013-12-11 17:48:23: Marc-Oliver Pahl
2013-12-11 17:47:41: Marc-Oliver Pahl
2013-12-11 17:47:26: Marc-Oliver Pahl - created -
Best Practise for Using the Template
When writing your service just copy&paste the template in the IDE to the source folder
and give it a speaking name like smartGateway or
extendedSmartGateway.
In the remainder of the lab we will create several services so you should create a new Java file for each of them.
2013-07-05 15:56:30: Marc-Oliver Pahl
2013-07-05 15:56:17: Marc-Oliver Pahl
2013-07-05 15:54:46: Marc-Oliver Pahl - created -
API Documentation
Remember that you can find the full Application Programming Interface (API) documentation here: https://dev.ds2os.org/job/ds2os-core/javadoc/.
The Connector class implements the IConnector interface. You can
find its particular documentation here
as linked in the PreLab:
Application Programming Interface.
There
you also find the documentation for the ISubscriber and the
IVirtualNodeHandler. (Go to org.ds2os.connector).
2014-01-05 11:47:45: Marc-Oliver Pahl
2014-01-05 11:45:21: Marc-Oliver Pahl
2014-01-05 11:40:30: Marc-Oliver Pahl
2014-01-05 11:39:38: Marc-Oliver Pahl - created -
...
Setup
In Eclipse open the org.ds2os.services.template files
ServiceTemplate.java and ServiceTemplateHandler.java. You know
the structure of the
files from the prelab already.
Start the ServiceTemplate.
2013-12-11 18:11:47: Marc-Oliver Pahl
2013-12-11 18:11:00: Marc-Oliver Pahl
2013-12-11 17:52:12: Marc-Oliver Pahl - created -
Playing with the Virtual Nodes
Get some greetings by issuing get greet/iLab2 in the agent console:
system@pc6.1: /pc6.1/demoService % get greet/iLab2
Now test the set functionality on this node. Where is the output shown?
Greet yourself using set "greet/First Name" "Second Name".
With the code, this test, and the knowledge from the prelab make sure that both of you understand how the Virtual Nodes are programmed.
2013-12-11 18:47:20: Marc-Oliver Pahl
2013-12-11 18:42:01: Marc-Oliver Pahl
2013-12-11 18:41:20: Marc-Oliver Pahl
2013-12-11 18:39:09: Marc-Oliver Pahl
...
IVirtualNodeHandler
interface. When are the methods called? What do the parameters contain?
new IVirtualNodeHandler() {
  public void set(String address, String value, String writerID);
  public String get(String address, String readerID);
}
2013-12-11 19:02:36: Marc-Oliver Pahl
2013-12-11 18:56:05: Marc-Oliver Pahl
2013-12-11 18:56:01: Marc-Oliver Pahl
2013-12-11 18:55:23: Marc-Oliver Pahl
...
Playing with the Subscriptions
Now let us test the tickle functionality.
set tickle 1
What happens?
After 10 seconds query the isLaughing node. Then set the tickle again and
query the isLaughing within 10 seconds.
2013-12-11 18:58:37: Marc-Oliver Pahl
2013-12-11 18:58:21: Marc-Oliver Pahl
2013-12-11 18:57:33: Marc-Oliver Pahl - created -
isLaughing node and the
tickle node?
2013-12-11 19:07:34: Marc-Oliver Pahl
2013-12-11 19:03:02: Marc-Oliver Pahl - created -
To get you started with your Smart Gateway we provide you with an example gateway:
the uptimeGateway. It already implements many analog features to the Smart
Gateway we will develop now.
It interfaces the shell command uptime. Try it on the shell. It results in the
following output:
grml@pcgrml@pc2 ~ % uptime
 15:34:42 up  2:24,  1 user,  load average: 0.00, 0.01, 0.05
As mentioned
in the feature listing, the uptimeGateway provides us with information
about the PC it is running on.
The model of our example uptimeGateway is
/gateway/shell/uptime.xml:
<uptime>
  <time type="/derived/time"></time>
  <uptime type="/derived/uptime"></uptime>
  <usersLoggedIn type="/basic/number"></usersLoggedIn>
  <loadAverage type="/derived/loadAverage"></loadAverage>
</uptime>
The uptime uptimeGateway is part of the service
template .
Let us test the functionality of the uptimeGateway:
- Start the
uptimeGateway(and a VSL Knowledge Agent) on PC1, PC2, PC3, and PC4. - Use the console on one of the agents and type
search /gateway/shell/uptime - Access the uptime data of all PCs via get request
When adding /value to the address of the node you want to read, you will
retrieve its value only.
2013-12-11 18:02:59: Marc-Oliver Pahl
2013-12-11 18:02:21: Marc-Oliver Pahl
2013-12-11 17:59:11: Marc-Oliver Pahl
2013-07-03 12:15:46: Marc-Oliver Pahl
...
2013-06-10 16:20:46: Marc-Oliver Pahl
2013-06-10 16:20:01: Marc-Oliver Pahl
2013-06-10 16:13:49: Marc-Oliver Pahl - created -
2013-06-10 16:24:33: Marc-Oliver Pahl
2013-06-10 16:20:28: Marc-Oliver Pahl - created -
After all preparations it is time to connect your Smart Device with your
Model /ilab/smartDevice now.
The task of the Smart Gateway is to keep the virtual representation and the physical state of your Smart Device synchronized. Therefore your Smart Gateway uses the protocol messages that we specified before.
2013-12-11 19:10:33: Marc-Oliver Pahl
2013-07-03 01:25:39: Marc-Oliver Pahl
2013-07-02 23:47:55: Marc-Oliver Pahl
2013-07-02 18:07:34: Marc-Oliver Pahl
...
Creating new Services
To create a new service, use the source of the service template as base. Simply
- copy the package
org.ds2os.services.templatein the template and name itorg.ds2os.services.smartGateway(paste and rename). - Refactor the
ServiceTemplate.javatoSmartGateway.java - Refactor the
ServiceTemplateHandler.javatoSmartGatewayHandler.java
Your task on this page is to interface your protocol and your model with your SmartGateway.
Here you find your model again:
2013-12-11 19:12:17: Marc-Oliver Pahl
2013-07-03 12:17:34: Marc-Oliver Pahl
2013-07-03 12:14:39: Marc-Oliver Pahl
2013-07-02 18:09:09: Marc-Oliver Pahl
...
2013-12-12 10:36:27: Marc-Oliver Pahl
2013-12-11 22:51:09: Marc-Oliver Pahl
2013-12-11 17:16:36: Marc-Oliver Pahl
2013-07-30 13:35:20: Marc-Oliver Pahl
...
A TCP Socket Connection with JAVA
telnet does nothing else but opening a TCP connection to exchange data. As we
want to automate the access we need to do what telnet does with Java.
You may find the following class interesting. It is the ArduinoTcpClient.java
that you find in the service template already. There is also a second implementation for
the IArduinoTcpClient interface that you can use to develop without the
Arduino hardware (ArduinoTcpSimulator.java).
This is a simplified version of what you find in the archive. Have a look at the implementation there. What additional error handling does the version from the archive have?
public class ArduinoTcpClient implements IArduinoTcpClient {
    Socket socket;
    BufferedReader in;
    BufferedWriter out;

    public ArduinoTcpClient(String address, int port) throws UnknownHostException, IOException {
        socket = new Socket(address, port);
        socket.setSoTimeout(500);
        in = new BufferedReader(new InputStreamReader(socket.getInputStream()));
        out = new BufferedWriter(new OutputStreamWriter(socket.getOutputStream()));
    }

    @Override
    public String set(String identifier, String value) {
        if (value == null) {
            return arduinoComm("@set:" + identifier);
        } else {
            return arduinoComm("@set:" + identifier + "=" + value);
        }
    }

    @Override
    public String get(String identifier) {
        return arduinoComm("@get:" + identifier);
    }

    private String arduinoComm(String message) {
        synchronized (out) {
            synchronized (in) {
                String result = null;
                try {
                    do {
                        System.out.print(".");
                        out.write(message);
                        out.write(System.getProperty("line.separator"));
                        out.flush();
                    } while (((result = in.readLine()) == null));
                } catch (IOException e) {
                    result = e.getLocalizedMessage();
                }
                System.out.println("out: " + message + " in: " + result);
                return result;
            }
        }
    }
}
Do not forget to make the TelnetClient program wide accessible...
2013-12-12 17:27:57: Marc-Oliver Pahl
2013-12-11 22:54:52: Marc-Oliver Pahl
2013-12-11 22:54:37: Marc-Oliver Pahl
2013-12-11 19:46:14: Marc-Oliver Pahl
...
Periodic Tasks in Java
Our SmartDevice is passive. It does not trigger message (unless you implemented such feature).
To keep the Model instance of your /ilab/smartDevice synchronized with
the reality we will use a timer thread similar to the UptimeGateway or the
ServiceTemplate implementation.
Look at those implementations.
2013-12-15 14:10:19: Marc-Oliver Pahl
2013-12-11 19:54:03: Marc-Oliver Pahl
2013-07-07 13:45:23: Marc-Oliver Pahl
2013-07-03 01:35:49: Marc-Oliver Pahl
...
API Documentation
Remember that you can find the full Application Programming Interface (API) documentation here: https://dev.ds2os.org/job/ds2os-core/javadoc/.
The Connector class implements the IConnector interface. You can
find its particular documentation here
as linked in the PreLab:
Application Programming Interface.
There
you also find the documentation for the ISubscriber and the
IVirtualNodeHandler. (Go to org.ds2os.connector).
2014-01-05 11:47:45: Marc-Oliver Pahl
2014-01-05 11:45:21: Marc-Oliver Pahl
2014-01-05 11:40:30: Marc-Oliver Pahl
2014-01-05 11:39:38: Marc-Oliver Pahl - created -
...
Tasks and Requirements
- Use your model as interface to your SmartGateway.
- Access the Arduino via a TCP socket connection.
- Use a periodic task to poll the state of the peripherals of your smart device.
- Use the proposed two class scheme to separate the wiring and the functionality.
- For reflecting changes in your model
back to your smart device use the subscription
feature. (This applies to the nodes
ledRed, ledYellow, ledGreen, ledOnBoard, timer0, timer1, your additional nodes.)- Remember the required autonomous
architecture from the PreLab with the
desirednode to be set from the outside and the node itself, e.g.timer0, only being set by your gateways service.
- Remember the required autonomous
architecture from the PreLab with the
- For the timers:
- Add two additional virtual
nodes to access the two timers in read and write direction. Both timers should be
settable over their desired node and over the virtual set request on the node itself.
We need these Virtual Nodes for runtime measurements at the end. (This applies to the
nodes
vTimer0, vTimer1.) - The following handlers should be registered for
timer0and corresponding ones fortimer1:c.subscribe(myKnowledgeRoot + "/timer0/desired", mySubscriptionhandler); c.registerVirtualNode(myKnowledgeRoot + "/vTimer0", myVirtualNodeHandler);
- As the Arduino is returning the set value on a set on a timer, use this value
directly in the regular node case (with the asynchronous subscriptions on
timer0/desiredandtimer1/desired) to set the returned value to the nodestimer0andtimer1.
In pseudocode:if ((subscriptionNotification on timer1/desired) && (get(timer1/desired) == 1)){ returnValue = Arduino.set(timer_1, 1); returnValue = parseAwayFieldName( returnValue ); set timer1 returnValue; }
- Add two additional virtual
nodes to access the two timers in read and write direction. Both timers should be
settable over their desired node and over the virtual set request on the node itself.
We need these Virtual Nodes for runtime measurements at the end. (This applies to the
nodes
2014-01-10 15:08:56 Marc-Oliver Pahl
2014-01-10 15:05:50 Marc-Oliver Pahl
2014-01-10 15:03:22 Marc-Oliver Pahl
2014-01-10 14:41:28 Marc-Oliver Pahl
...
Do not forget to remove the field names the Arduino code sends before saving the
value to the VSL. So do not save timer0=1234567 but only 1234567
in case of a timer for instance.
Test your gateway
...by remotely reading and changing the values of your model using the console of the agent on PC2.
Does it work? Can you remotely control your Smart Device? Nice =)
Does the periodic update work too? If your button still does something you can test it...
2013-07-07 13:47:16: Marc-Oliver Pahl
2013-07-03 12:18:15: Marc-Oliver Pahl
2013-07-02 23:32:45: Marc-Oliver Pahl
2013-07-02 23:32:33: Marc-Oliver Pahl
...
With the console command ll you can change the log level of the agent.
ll debug gives you more information. It also affects the node meta data. You
will see the access rights and the subscribers in debug mode. With ll warn you
get back to the normal log level.
registerSubscriptions()).
... 20:15:50 Marc-Oliver Pahl
2013-12-15 14:12:00: Marc-Oliver Pahl
2013-12-12 14:38:16: Marc-Oliver Pahl
2013-12-12 11:38:38: Marc-Oliver Pahl
...
registerVirtualNodeHandlers()).
2014-01-05 21:18:42: Marc-Oliver Pahl
2013-12-15 14:12:18: Marc-Oliver Pahl
2013-12-15 14:11:05: Marc-Oliver Pahl
2013-12-12 17:14:50: Marc-Oliver Pahl
...
List of uploaded files
2013-12-12 11:36:55: Marc-Oliver Pahl
2013-12-11 22:41:59: Marc-Oliver Pahl
2013-12-11 19:38:45: Marc-Oliver Pahl
2013-12-11 19:38:41: Marc-Oliver Pahl
...
List of uploaded files
2013-12-15 14:13:37: Marc-Oliver Pahl
2013-12-12 17:14:39: Marc-Oliver Pahl
2013-12-12 11:40:11: Marc-Oliver Pahl
2013-12-12 11:39:15: Marc-Oliver Pahl
...
2013-07-08 13:31:55: Marc-Oliver Pahl
2013-07-08 13:02:58: Marc-Oliver Pahl
2013-07-08 13:01:29: Marc-Oliver Pahl - created -
As you created the Gateway Service you are an expert in service creation already.
So far we accessed our Smart Device and the uptime gateway only via the
debug console to orchestrated our smart space. Now it is time to write programs that do
orchestration to see the potential of the solution.
You will see this is straight forward with the VSL as abstraction and the gateways providing the abstraction over the heterogeneous hardware devices.
First we will write an Advanced Reasoning Service that reads knowledge from the VSL, infers information and stores the new information in the VSL.
Make sure the uptime gateway is still running on your machines.
Our first Advanced Reasoning Service will search for all uptime gateways by type and provide
- sum of the current uptimes of all PCs
- sum of the current amount of logged in users on all PCs
- mean of the current loads of all PCs
- mean of the maximum loads of the available intervals of all PCs
- if you want add more
2014-01-04 18:08:41: Marc-Oliver Pahl
2013-06-19 22:35:41: Marc-Oliver Pahl
2013-06-11 21:03:01: Marc-Oliver Pahl
2013-06-11 20:24:08: Marc-Oliver Pahl
...
List of uploaded files
... 11:22:49 Fabian Oehlmann
... 20:16:46 Marc-Oliver Pahl
2013-12-12 14:41:34: Marc-Oliver Pahl
2013-12-12 14:39:15: Marc-Oliver Pahl
...
2013-06-11 21:06:22: Marc-Oliver Pahl
2013-06-11 21:04:51: Marc-Oliver Pahl - created -
2013-07-02 10:45:29: Marc-Oliver Pahl
2013-06-11 21:08:20: Marc-Oliver Pahl
2013-06-11 21:06:30: Marc-Oliver Pahl - created -
Now implement your first Advanced Reasoning Service using the service template.
2013-07-03 12:19:16: Marc-Oliver Pahl
2013-06-19 22:37:12: Marc-Oliver Pahl
2013-06-11 21:09:34: Marc-Oliver Pahl
2013-06-11 21:08:31: Marc-Oliver Pahl - created -
...
2013-12-12 14:11:51: Marc-Oliver Pahl
2013-12-12 14:11:05: Marc-Oliver Pahl - created -
... 21:58:13 Fabian Oehlmann
2013-12-12 14:12:12: Marc-Oliver Pahl - created -
List of uploaded files
2013-12-12 14:15:59: Marc-Oliver Pahl
2013-06-11 21:43:33: Marc-Oliver Pahl
2013-06-11 21:04:36: Marc-Oliver Pahl
2013-06-11 21:03:23: Marc-Oliver Pahl - created -
...
2013-12-12 14:16:28: Marc-Oliver Pahl
2013-08-19 23:23:47: Fabian Oehlmann
2013-07-30 13:38:52: Marc-Oliver Pahl
2013-06-11 21:11:10: Marc-Oliver Pahl
...
Now it is time to write an Advanced Reasoning Service for your device. We will use it to provide the temperature in Celsius and Fahrenheit.
- Create a model for your new service.
- Add nodes for the temperature in Celsius and Fahrenheit
- Add a node for dynamically storing the address of the device your service will use
Here you find the necessary information for transforming the raw value to degrees Celsius and Fahrenheit.
2013-07-02 22:19:35: Marc-Oliver Pahl
2013-07-02 10:52:21: Marc-Oliver Pahl
2013-07-02 10:46:50: Marc-Oliver Pahl
2013-06-24 17:10:14: Marc-Oliver Pahl
...
List of uploaded files
... 22:01:19 Fabian Oehlmann
... 20:17:30 Marc-Oliver Pahl
2013-12-12 14:16:48: Marc-Oliver Pahl
2013-06-11 21:42:18: Marc-Oliver Pahl
...
Now implement your service that offers the temperature in Celsius and Fahrenheit.
- Make it retrieve (via
search) and use your device. - Permanently bind it to the first instance of your
smartDevicethat it finds by storing the respective local address in your services store in the VSL under a node.
Storing the context (device address) in the VSL shows you how DS2OS services can hold there own state using the VSL...
2013-06-11 21:25:45: Marc-Oliver Pahl
2013-06-11 21:23:54: Marc-Oliver Pahl
2013-06-11 21:22:56: Marc-Oliver Pahl - created -
... 22:10:38 Fabian Oehlmann
... 22:10:19 Fabian Oehlmann
... 20:18:10 Marc-Oliver Pahl
... 20:17:39 Marc-Oliver Pahl
...
... 20:18:16 Marc-Oliver Pahl
... 20:17:45 Marc-Oliver Pahl
2013-12-12 14:19:27: Marc-Oliver Pahl
2013-12-12 14:17:54: Marc-Oliver Pahl - created -
List of uploaded files
2013-06-11 21:42:24: Marc-Oliver Pahl
2013-06-11 21:42:07: Marc-Oliver Pahl
2013-06-11 21:41:58: Marc-Oliver Pahl
2013-06-11 21:26:03: Marc-Oliver Pahl
...
2013-06-11 21:36:42: Marc-Oliver Pahl
2013-06-11 21:35:43: Marc-Oliver Pahl - created -
2013-07-30 13:17:39: Marc-Oliver Pahl
2013-06-24 16:27:02: Marc-Oliver Pahl
2013-06-12 12:28:24: Marc-Oliver Pahl
2013-06-12 12:27:14: Marc-Oliver Pahl
...
Now it is time to implement it... as we do not want to reuse our component you do not have to create a model this time.
2013-06-11 21:38:03: Marc-Oliver Pahl
2013-06-11 21:37:30: Marc-Oliver Pahl - created -
... 22:26:52 Fabian Oehlmann
... 20:19:16 Marc-Oliver Pahl
... 20:18:28 Marc-Oliver Pahl
2013-12-12 14:21:36: Marc-Oliver Pahl
...
... 22:28:15 Fabian Oehlmann
... 20:19:24 Marc-Oliver Pahl
... 20:18:35 Marc-Oliver Pahl
2013-12-12 14:21:42: Marc-Oliver Pahl
...
List of uploaded files
2013-07-30 13:42:55: Marc-Oliver Pahl
2013-06-11 21:43:50: Marc-Oliver Pahl
2013-06-11 21:39:57: Marc-Oliver Pahl
2013-06-11 21:39:28: Marc-Oliver Pahl
...
Did you imagine that it could be so easy to realize your workflow when you wrote it at the beginning?
When you obtain Gateway Services and Advanced Reasoning Services via an App Store you only have to write the piece of code you wrote on this page. Impressive, isn't it?
2013-06-11 21:41:19: Marc-Oliver Pahl
2013-06-11 21:40:10: Marc-Oliver Pahl - created -
2013-12-12 14:22:34: Marc-Oliver Pahl
2013-06-24 17:18:37: Marc-Oliver Pahl
2013-06-24 17:17:47: Marc-Oliver Pahl
2013-06-24 17:15:43: Marc-Oliver Pahl - created -
You can make a break soon, but before start the second measurement so that it can run when you are away.
Starting the Second Measurement
With the second measurement we want to measure the latencies when accessing the Arduino.
We run one measurement on PC5 where the Smart Gateway runs and the Arduino is directly attached. Later we will run another measurement on another host (PC2).
2013-12-12 20:44:16: Marc-Oliver Pahl
2013-12-12 20:08:26: Marc-Oliver Pahl
2013-12-12 14:23:45: Marc-Oliver Pahl
2013-12-12 14:23:38: Marc-Oliver Pahl
...
Make sure the vTimers exist
Unluckily I forgot to ad the vTimer nodes to the model until 2014-09-01. Please make sure your smart device contains the following nodes and handlers for them:
<smartDevice>
    ...
    <vTimer0 type="/ilab/vTimer" reader="*" writer="*"></vTimer0>
    <vTimer1 type="/ilab/vTimer" reader="*" writer="*"></vTimer1>
</smartDevice>
2014-01-09 12:26:57: Marc-Oliver Pahl
2014-01-09 12:25:44: Marc-Oliver Pahl - created -
PC5
We start on PC5.
-
Change your
SmartGatewayHandlerimplementation so that it does not poll any data periodically from the Arduino anymore. - Make sure, the Knowledge Agent and your changed Smart Gateway are running.
- Start the
LatencyToDeviceMeasurerthat you find in the service template.
If you followed the Tasks and Requirements the measurement should work properly now.
If the measurement seems not to work as expected look into the code of the
LatencyToDeviceMeasurer to see which behaviour of you SmartGateway is
expected. The behaviour of the LatencyToDeviceMeasurer is also
described in a time-sequence diagram here.
The test will start now as described above. It will create a log file. Make sure that the
log file gets filled with data using the tail -f command in the shell.
The log file content should be similar to:
0       151     42      131     228     52      159     11812539        11812849
1       143     41      117     229     36      157     11813259        11813559
2       143     22      138     258     42      152     11813964        11814259
3       153     32      104     207     22      147     11814670        11814970
4       173     32      121     239     31      113     11815374        11815660
5       143     31      127     248     32      163     11816065        11816371
Now keep the service running until it has collected 500 samples. You can continue with the lab meanwhile.
2014-01-10 14:46:21 Marc-Oliver Pahl
2013-12-12 23:15:57: Marc-Oliver Pahl
2013-12-12 22:59:53: Marc-Oliver Pahl
2013-12-12 20:52:27: Marc-Oliver Pahl
...
2013-07-08 13:31:55: Marc-Oliver Pahl
2013-07-08 13:02:58: Marc-Oliver Pahl
2013-07-08 13:01:29: Marc-Oliver Pahl - created -
11.2. Statistics and GNUplot
In this last part we will evaluate the collected data about DS2OS using our statistic background and our knowledge about GNUplot.
Here you find a copy of the GNUplot documentation: gnuplot.pdf.
2013-12-12 20:55:38: Marc-Oliver Pahl
2013-12-12 11:28:27: Marc-Oliver Pahl
2013-12-12 11:26:42: Marc-Oliver Pahl - created -
Evaluating initial measurement intro
Now we will evaluate the initial performance measurement data we collected before.
Download the data again from here:
2013-12-09 17:13:01: Marc-Oliver Pahl
2013-12-09 17:12:17: Marc-Oliver Pahl
2013-12-09 17:11:53: Marc-Oliver Pahl
2013-12-09 17:10:21: Marc-Oliver Pahl - created -
...
List of uploaded files
2013-12-13 14:20:13: Marc-Oliver Pahl
2013-12-09 17:16:23: Marc-Oliver Pahl
2013-12-09 16:57:35: Marc-Oliver Pahl
2013-12-09 16:57:31: Marc-Oliver Pahl
...
Plotting the results of your measurement
In order to plot the results of your measurement, you have to download the following scripts: plot.tar.gz
The scripts will extract the data from the log-files and do statistical computations for you. All you have to do is to extract them and afterwards invoke them using
./plotMeasurements.sh logsFolder fullRunStartAmount fullRunStepping
The first argument to the script is the folder in which your measurement logs are. The second and third are the amount of clients you started the measurement with and how the amount of clients was decreased in each round. You can look up the setup of the initial measurements here.
The output of the script is four pdf files for each of the test modes. The first shows the measured delay of the requests and actually contains two plots: One displays the quantiles of the values measured using gnuplot's boxplot. The other one displays 0.99 confidence intervals of the same data, as well as the range of all values measured. The second, third, and fourth files show the amount of processed requests per second along the runtime of the measurement. The files will be output in the same folder, where the script is.
Your 16 resulting plots should look similar to the following:
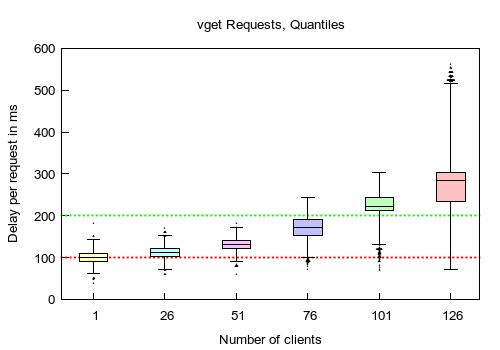
The first output, which visualizes the delay measurement
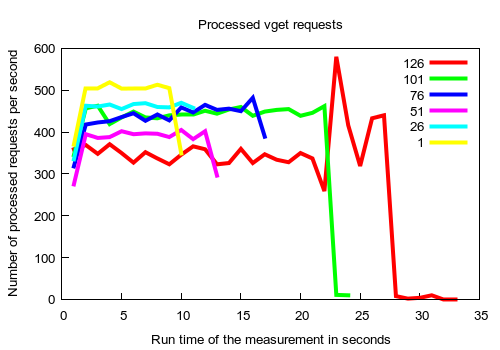
The second file illustrating the throughput
From what you have learned about the VSL architecture, it is clear that the get and set
delay log files and the throughput logfiles are not applicable for the measurement server
for regular VSL requests.
Why?
... 19:39:41 Fabian Oehlmann
... 19:38:32 Fabian Oehlmann
2014-01-07 19:12:25: Marc-Oliver Pahl
2014-01-07 19:12:05: Marc-Oliver Pahl
...
... 20:19:48 Marc-Oliver Pahl
2013-12-17 20:53:50: Marc-Oliver Pahl
2013-12-17 20:53:13: Marc-Oliver Pahl
2013-12-17 20:51:10: Marc-Oliver Pahl
...
List of uploaded files
... 19:35:45 Fabian Oehlmann
... 19:35:06 Fabian Oehlmann
2013-12-13 15:39:37: Fabian Oehlmann
2013-12-12 20:57:54: Marc-Oliver Pahl
...
First Measurement done?
Did the second measurement finish? If not, wait until it does.
The log file should contain 500 samples now.
2013-07-08 10:31:21: Marc-Oliver Pahl
2013-07-08 10:30:45: Marc-Oliver Pahl
2013-07-08 10:30:19: Marc-Oliver Pahl - created -
Third Measurement
Now start the LatencyToDeviceMeasurer service on PC2. Make sure it is
running by having a look at the log file with tail -f [yourLogFile]. When it
runs and the log file on PC2 grows, continue answering.
2013-12-12 21:06:25: Marc-Oliver Pahl
2013-08-20 13:02:37: Fabian Oehlmann
2013-07-08 10:31:47: Marc-Oliver Pahl
2013-07-08 10:28:05: Marc-Oliver Pahl - created -
...
List of uploaded files
2013-12-12 23:23:10: Marc-Oliver Pahl
2013-12-12 21:49:47: Marc-Oliver Pahl - created -
Now let us have a look at the measurement code
Now we have a look at the LatencyToDeviceMeasurer that you find in the
service template.
In controls the measurement.
2013-12-13 11:01:40: Marc-Oliver Pahl
2013-12-13 11:00:57: Marc-Oliver Pahl - created -
We want to measure:
- Latency of local set via synchronous VSL set (Virtual Node).
- Latency of local set via asynchronous VSL set (regular node).
- Latency until the notification of the synchronous VSL set (regular node) returns.
- Latency of local get via synchronous VSL get (Virtual Node).
- Latency of local get via asynchronous VSL get (regular node).
- Time the asynchronous set takes longer than the synchronous one until the change arrives at the device = additional processing time for the asynchronous request.
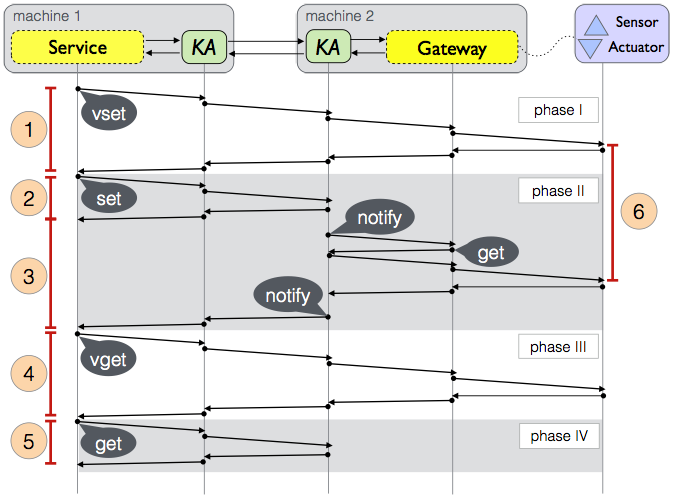
Fig.: TS1 - Time Diagram of the Measurement
2013-12-13 15:20:59: Marc-Oliver Pahl
2013-12-13 11:15:52: Marc-Oliver Pahl
2013-12-13 11:09:51: Marc-Oliver Pahl
2013-12-12 22:59:19: Marc-Oliver Pahl
...
LatencyToDeviceMeasurer realized?
2013-12-13 11:10:45: Marc-Oliver Pahl
2013-12-13 11:10:27: Marc-Oliver Pahl
2013-12-12 23:02:44: Marc-Oliver Pahl
2013-12-12 20:54:49: Marc-Oliver Pahl
...
 - [variableName] (#numbers)
 - vsetMillis (1)
2013-12-13 15:54:46: Marc-Oliver Pahl
2013-12-13 15:54:30: Marc-Oliver Pahl
2013-12-13 15:54:11: Marc-Oliver Pahl
2013-12-13 15:53:43: Marc-Oliver Pahl
...
2013-12-12 21:23:21: Marc-Oliver Pahl
2013-12-12 21:22:47: Marc-Oliver Pahl
2013-12-12 21:21:44: Marc-Oliver Pahl - created -
2013-12-13 11:14:20: Marc-Oliver Pahl
2013-12-13 11:14:05: Marc-Oliver Pahl
2013-12-13 11:11:16: Marc-Oliver Pahl - created -
What is in the log files of the 2nd and 3rd measurement?
The measurement happens in the run() method of the
LatencyToDeviceMeasurer.
The log line gets created by
String logLine = i + "\t" + vsetMillis + "\t" + setMillis + "\t" +notificationMillis
                   +  "\t" + vgetMillis + "\t" + getMillis + "\t" + deltaMillis + "\t"
                   + timer0Device + "\t" + timer1Device;
2013-12-12 21:25:37: Marc-Oliver Pahl
2013-12-12 20:07:25: Marc-Oliver Pahl
2013-12-12 20:06:05: Marc-Oliver Pahl - created -
Plotting your data
Now we will use GNUplot to make a boxplot of your collected data.
We will make boxplots for the times the different get and set operations take, for the delay between the two set calls on the device and the ratio of the differences between sending the sets and their execution on the Arduino. For the sending difference simply use the time of the synchronous set + the asynchronous set.
Here is a simple GNUplot script for making a boxplot:
#set terminal pdf
#set output 'out.pdf'

set terminal wxt

pc5file = 'PC5.log'

set style line 1 linecolor rgb '#FA8072' pointtype 7 pointsize 0.1

set style fill solid border -1
set style data boxplot

set title 'Smart Space Measurements'

set xlabel 'Measurement'
set xtics ('vset' 1, 'set' 2)

set ylabel 'Time in Milliseconds'
set yrange [0 : ]
set grid y

plot pc5file using (1):2:(0.5) linestyle 1 title 'PC5', \
     pc5file using (2):3:(0.5) linestyle 1 notitle

pause -1
Discuss in your team what the script roughly does.
Execute the script on your logfile (change pc5file = 'PC5.log').
Now you should get a plot that has some similarities to this one:
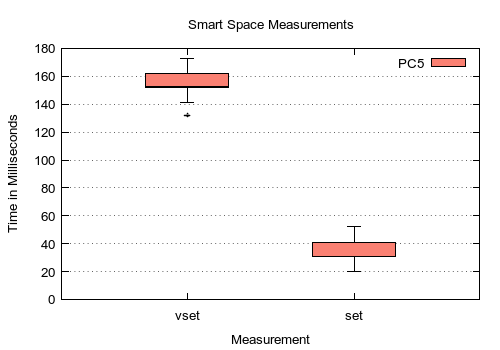
An example evaluation running the GNUplot script given above on your collected data.
2013-12-13 14:33:39: Fabian Oehlmann
2013-12-13 14:32:15: Fabian Oehlmann
2013-12-13 14:27:08: Fabian Oehlmann
2013-12-13 14:26:37: Marc-Oliver Pahl
...
List of uploaded files
2013-12-12 23:23:10: Marc-Oliver Pahl
2013-12-12 21:49:47: Marc-Oliver Pahl - created -
2013-12-12 21:47:29: Marc-Oliver Pahl
2013-07-08 10:44:14: Marc-Oliver Pahl
2013-07-08 10:41:33: Marc-Oliver Pahl - created -
List of uploaded files
2013-12-12 23:28:18: Marc-Oliver Pahl
2013-12-12 21:40:22: Marc-Oliver Pahl
2013-12-12 21:38:07: Marc-Oliver Pahl
2013-07-08 10:43:15: Marc-Oliver Pahl - created -
...
Now evaluate the second (PC5) and third measurement (PC2) creating a combined boxplot as follows:
set terminal pdf
set output 'delay_svc-KA-KA-svc-device.pdf'

local = 'local.log'
remote = 'remote.log'
regularSamples = 0.999

file = '< paste '.local.' '.remote

set style line 1 linecolor rgb '#FA8072' pointtype 7 pointsize 0.1
set style line 2 linecolor rgb '#87CEFA' pointtype 7 pointsize 0.1
set style line 3 linecolor rgb '#3CB371' pointtype 7 pointsize 0.1
set style line 4 linecolor rgb 'red' linewidth 2

set object rect from 0,101 to 6.5,199 fc rgb "#ffffaa" fs solid 1.0 noborder
set object rect from 0,201 to 6.5,299 fc rgb "#ffffcc" fs solid 1.0 noborder

set style fill solid border -1
set style boxplot fraction regularSamples
set style data boxplot

set xlabel 'VSL operation'
set xtics ('vset (1)' 1, 'set (2)' 2, '(2)+(3)' 3, 'vget (3)' 4, 'get (4)' 5, '(6)-(1)' 6)
set xrange [0.5 : 6.5]

set ylabel 'Time in Milliseconds'
set yrange [0 : 500]
set grid y

sum(filename, column) = system("awk '{N+=$".column."}; END {print N}' ".filename)
count(filename) = system("awk 'END{print NR}' ".filename)
mean(filename, column) = sum(filename, column) / count(filename)

set title 'DS2OS Service-KA-(KA-)Service-Device Delay Measurements ('.count(local).'; '.sprintf('%.3f', regularSamples).')'

# plot mean differences...
set style arrow 8 heads size screen 0.008,90 ls 4
rows="2 3 4 5 6 7"
do for [c=1:6] {
  lowMean = mean(local, word(rows,c))
  highMean = mean(remote, word(rows,c))
  if (c==3){
    lowMean=lowMean+mean(local,word(rows,2))
    highMean=highMean+mean(remote,word(rows,2))
  }
  set arrow from c,lowMean to c,highMean arrowstyle 8
  set label sprintf("%.2f ms",highMean-lowMean) at c,highMean+25 rotate left font ",8" tc rgb '#888888'
  set label sprintf("%d",highMean-lowMean) at c+0.07,(lowMean/2)+(highMean/2) center rotate font ",6" tc rgb 'black'
  set label sprintf("%d",lowMean) at c,lowMean-12 center font ",6" tc rgb 'black'
  set label sprintf("%d",highMean) at c,highMean+10 center font ",6" tc rgb 'black'
}

plot file using (0.8):2:(0.15) linestyle 1 title 'local measurement (PC2)', \
     ''   using (1.8):3:(0.15) linestyle 1 notitle, \
     ''   using (2.8):($3+$4):(0.15) linestyle 1 notitle, \
     ''   using (3.8):5:(0.15) linestyle 1 notitle, \
     ''   using (4.8):6:(0.15) linestyle 1 notitle, \
     ''   using (5.8):7:(0.15) linestyle 1 notitle, \
     ''   using (1.2):11:(0.15) linestyle 2 title 'remote measurement (PC1)', \
     ''   using (2.2):12:(0.15) linestyle 2 notitle, \
     ''   using (3.2):($12+$13):(0.15) linestyle 2 notitle, \
     ''   using (4.2):14:(0.15) linestyle 2 notitle, \
     ''   using (5.2):15:(0.15) linestyle 2 notitle, \
     ''   using (6.2):16:(0.15) linestyle 2 notitle, \
     NaN ls 4 title "difference of the mean values"
Create symlinks to your respective log files to reflect the variable assignment to the files in the script. Execute the script.
2013-12-30 21:05:20: Marc-Oliver Pahl
2013-12-30 21:04:18: Marc-Oliver Pahl
2013-12-19 23:39:27: Marc-Oliver Pahl
2013-12-18 12:45:13: Fabian Oehlmann
...
Now you should get a plot that has some similarities to this one:
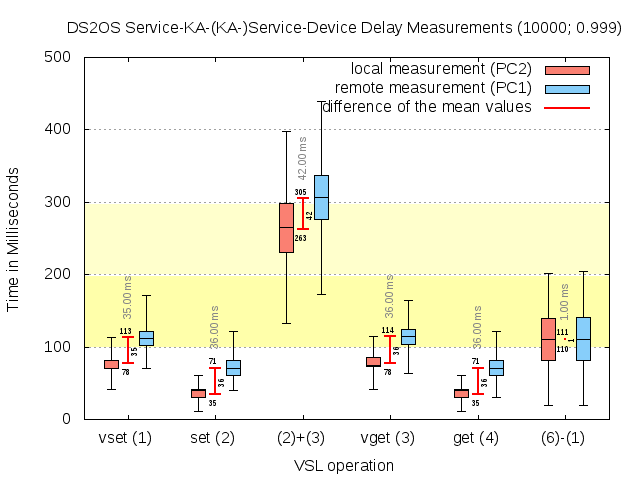
An example evaluation plot for the measurements 2 and 3.
List of uploaded files
2013-12-14 20:13:49: Fabian Oehlmann
2013-12-14 20:13:17: Fabian Oehlmann
2013-12-14 20:12:55: Fabian Oehlmann
2013-12-14 20:12:10: Fabian Oehlmann
...
What do the results of the 2nd and 3rd measurement tell us?
So far we looked at evaluating data. Now it is time for interpreting the results.
Discuss the result. What is the meaning of each plot element? What is shown? What do the plots tell us about the system?
What is the difference between the synchronous communication via the Virtual Nodes and the asynchronous communication over the VSL subscriptions?
What about the latencies for a service?
What about the delay until a value is set in another service, or on a device?
Do not forget to consider the interactivity delay from the prelab.
2013-12-13 00:46:51: Marc-Oliver Pahl
2013-12-12 21:58:41: Marc-Oliver Pahl
2013-12-12 21:55:25: Marc-Oliver Pahl - created -
... 20:16:26 Fabian Oehlmann
2013-12-12 21:54:36: Marc-Oliver Pahl
2013-12-12 21:53:24: Marc-Oliver Pahl - created -
12. Summary
It is over.
Congratulations, you learned a lot!
In this lab we did many many things together. Let us quickly recover some of the major points:
In the Smart Space Orchestration - PreLab, we started looking at the evolution of Ubiquitous Computing. We identified Heterogeneity as a Key Problem. As concrete examples for heterogeneity we looked at Building Automation Systems, and Other Common Interfaces.
For realizing different pervasive computing scenarios on shared hardware, it is necessary to apply Software Orchestration. We had a look at different Middleware. We found out that Context is relevant when orchestrating smart spaces.
Then we looked closer at the Distributed Smart Space Orchestration System (DS2OS). Having a system like DS2OS makes it possible to integrate Do-It-Yourself Hardware.
Concerning the Do-It-Yourself Hardware we had a closer look at the Arduino Project.
Finally we looked at Software Performance Evaluation with some information about Relevant Statistics.
The Smart Space Orchestration - Lab started with looking at a Web-based User Interface for DS2OS. We set up the VSL and played around with the context instantiation and the Agent Synchronization. Then we started the first Performance Measurement to give it some time to run.
Next, we started Building our own smart device. After Adding the Basic Components, we started Writing the Smart Device "Firmware". Our goal was to Remote Access to our Smart Device.
The we were Planning Your Scenario. As we wanted to include our own smart device we started Creating the VSL Model to our Device. For automating the Model dissemination process, we shared the model over the Model Repository.
Then we came to Programming DS2OS. After looking at The Demo Service Tickle-Greet and The Uptime Gateway, we were Writing our Smart Gateway Service.
As culmination point of our software orchestration experiment, we were Orchestrating our Smart Device with our Orchestration Logic. Here we also had a look at the modularization of functionality with Advanced Reasoning Services.
As last part we evaluated our three Performance evaluations that we made during the lab. We evaluated the Initial Measurement and the 2nd and 3rd Measurements quantitatively.
With this lab you did a qualitative analysis of DS2OS yourself.
We hope, you enjoyed working with the system!
If you are interested in making a Bachelor Thesis, Master Thesis, or to work as
student assistant in the context of DS2OS,
feel free to contact me.
2013-12-13 14:32:16: Marc-Oliver Pahl
2013-12-13 14:32:03: Marc-Oliver Pahl
2013-12-13 14:31:18: Marc-Oliver Pahl
2013-12-13 14:30:58: Marc-Oliver Pahl
...
You find this page at the end of every preLab and lab. It is shared between all team members and between preLab and lab. So all of you see the same files and information.
Sometimes you might want to save some text snippets or files to have them available when you restart with the lab or on another computer.
This section is exactly intended for this. You can temporarily store your configurations, commande, etc. here.
2011-10-17 15:50:30: Marc-Oliver Pahl
2011-10-17 15:50:11: Marc-Oliver Pahl
2011-10-17 14:46:25: Marc-Oliver Pahl
2011-10-17 14:46:07: Marc-Oliver Pahl
...
List of uploaded files
2011-10-17 14:47:38: Marc-Oliver Pahl
2011-10-17 14:43:55: Marc-Oliver Pahl - created -
What did you (dis-)like most about this lab? Do you have suggestions on what could be improved? Did you find any errors? If you have any suggestions or comments about the prelab or lab please let us know! This question has no bearing on your prelab completion.
2011-07-26 23:05:27: Marc-Oliver Pahl
2011-05-19 22:05:05: Marc-Oliver Pahl
2011-05-10 00:33:32: Marc-Oliver Pahl
2007-11-06 18:51:17: Marc-Oliver Pahl
...
2011-10-17 14:40:33: Marc-Oliver Pahl
2011-08-05 18:11:10: Anatol Dammer
2011-08-05 18:10:58: Anatol Dammer
2011-08-05 18:10:46: Anatol Dammer
...
... 14:52:10 Marc-Oliver Pahl
... 20:05:50 Marc-Oliver Pahl
... 20:00:36 Marc-Oliver Pahl
... 17:07:02 Marc-Oliver Pahl
...
In this exercise we have a closer look at the software-orchestration of smart spaces. You will build your own smart device, write a protocol for communicating with it, and write a driver that connects your device with the Distributed Smart Space Orchestration System (DS2OS), an operating system for smart spaces. Finally you will orchestrate your space using your device by creating different services.